
04 · Metrics
Buffer-to-Loss Ratio
ProBuffer-to-loss ratio is how many of your average losing trades fit before a prop account hits its drawdown floor. Formula, trailing vs static, and bands.
Buffer-to-loss ratio is how many of your average losing trades a prop account can absorb before it hits its drawdown floor. Limbix divides the room left to the floor by the average size of your losing trades on that account. €1,800 of room and a €450 average loser reads 4.0×: four normal losses from breach.
How it's calculated#
- Distance to breach
- Your account balance after paid payouts, minus the account's overall drawdown floor.
- Average losing trade
- The mean size of the losing trades on this account, as a positive amount.
src/lib/prop-hub.tsThe result is a multiple. The Risk page shows it with one decimal, or two when it is under 1. It truncates rather than rounds, so 1.46× shows as 1.4×, never 1.5×. Rounding up could carry an account across a warning line. Truncating can only ever show less room than you have.
Distance to breach is measured from your balance after withdrawals. When you mark a payout Paid, that money has left the account, so your room shrinks by the same amount.
The average losing trade is the mean loss across the losing trades on this account. It counts losing trades, not losing days. A trader with four losers before lunch has four data points, not one.
Where the floor sits: static vs trailing drawdown#
The floor comes from the account's Max drawdown $ and Drawdown type, which you set when you add the account. Limbix models three types.
| Drawdown type | Where the floor sits | What happens as you make money |
|---|---|---|
| Static floor | Starting balance minus max drawdown | Nothing. The floor never moves. |
| EOD trailing | Highest end-of-day balance minus max drawdown | The floor rises with each new closing high and never comes back down. |
| Intraday trailing | Highest balance after any closed trade minus max drawdown | The floor rises with each new high, even one given back the same day. |
A trailing floor can stop rising. That is the Trail locks at rule:
- Starting balance: the floor climbs until it reaches your starting balance, then stays there.
- Safety net: the floor stops at the level your firm's safety-net rule sets.
- Never locks: the floor follows every new high.
On a funded account, Limbix locks a trailing floor at the starting balance. Limbix models the trail as a fixed amount below your peak, and it reads your closed trades, not open positions tick by tick. So an intraday peak is measured after each closed trade. Firms that grow the allowance as a percentage of your peak are not modelled, so enter the currency limit your firm applies.
The ratio uses the overall floor only. Your daily loss limit is separate: it has its own Daily DD column on the Risk page.
Try it#
Worked example#
You hold a €50,000 evaluation with a Static floor and a €2,500 Max drawdown $. The floor sits at €47,500.
- Your balance is €49,300. Distance to breach: €49,300 − €47,500 = €1,800.
- You have four losing trades on this account: €450, €300, €600 and €450. Average losing trade: €1,800 ÷ 4 = €450.
- Buffer-to-loss: €1,800 ÷ €450 = 4.0×. The Risk page reads "about 4 average losers of room".
Then you take one more loss of €600.
- Balance: €48,700. Distance to breach: €1,200.
- Five losers now total €2,400. Average losing trade: €480.
- Buffer-to-loss: €1,200 ÷ €480 = 2.5×.
One trade took the ratio from 4.0× to 2.5×. The loss cut your room, and it also raised your average loser. Small losses can work the other way. A €100 loss next would leave €1,100 of room over a €416.67 average: 2.6×, higher than before, because the smaller loser pulled your average down.
When it shows "—"#
The ratio needs two numbers. If either is missing, Limbix says which one.
| What the Risk page says | Why |
|---|---|
| No average loss yet | The account has no losing trade yet, so there is nothing to divide by. |
| No overall floor to measure | The account has no overall drawdown rule, so there is no floor to measure from. Add Max drawdown $ to the account's rules. |
Only active accounts appear on the Risk page. A closed account has nothing left to protect.
What's a good buffer-to-loss ratio?#
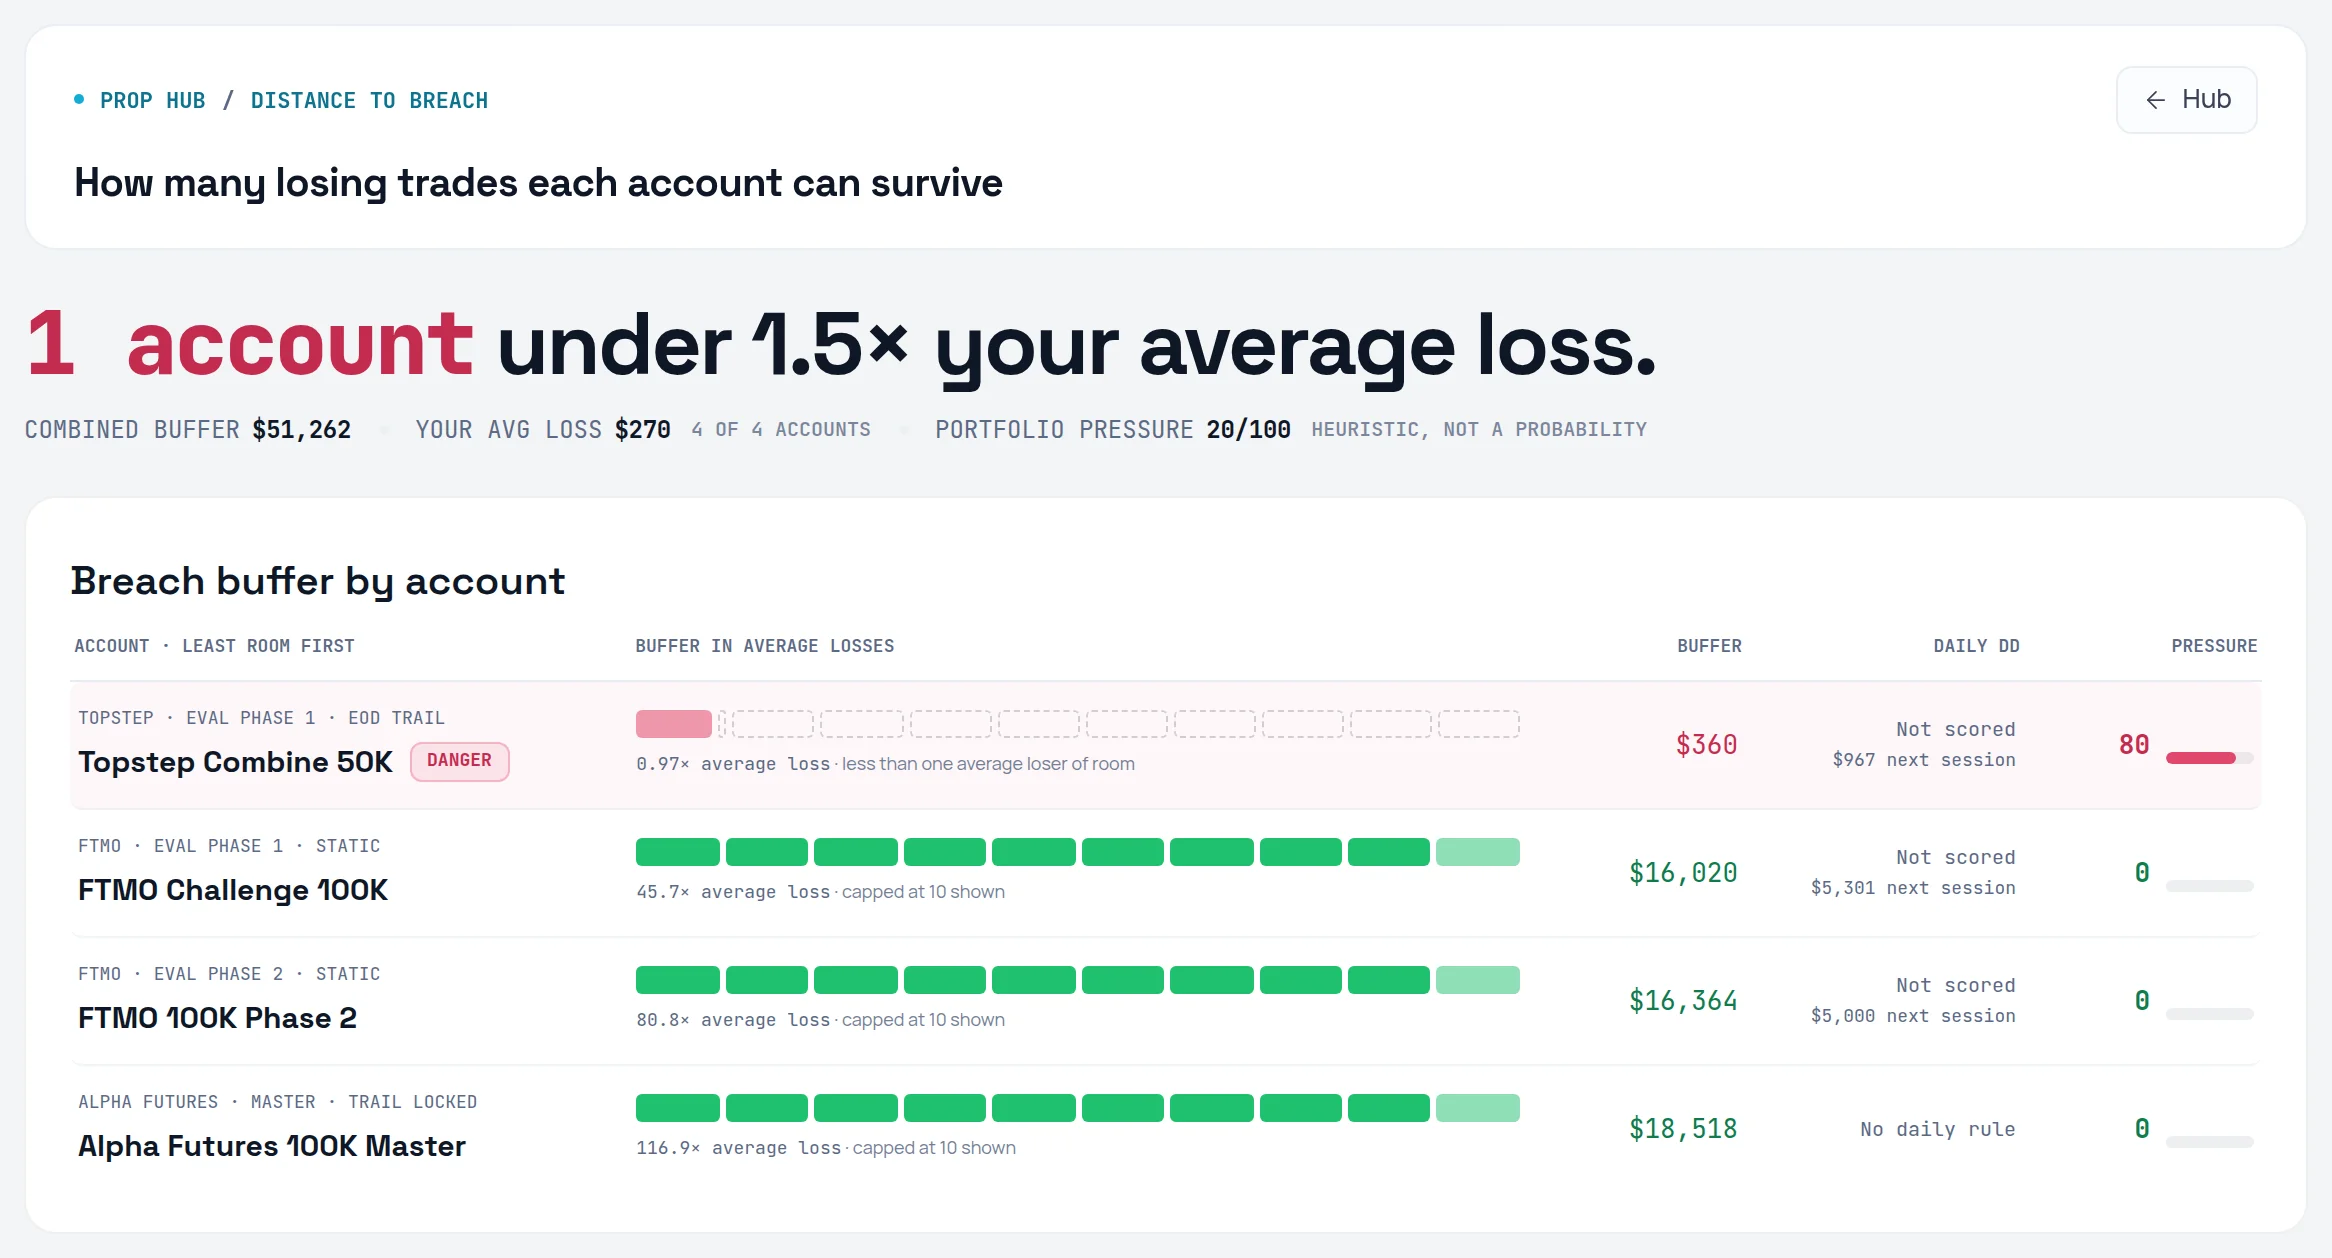
Limbix draws the danger line at 1.5×: under it, one average loser could end the account. The Risk page colours and flags every account on this scale:
- Danger 0 to 1.5
- Warning 1.5 to 5
- Comfortable 5+
| Ratio | Risk page | What it prints |
|---|---|---|
| 5× or more | Comfortable (green) | "comfortable" |
| 1.5× to under 5× | Warning (amber) | "about N average losers of room" |
| 1× to under 1.5× | Danger (red), listed in the Warning zone | "one average loser could end it" |
| Under 1× | Danger (red), listed in the Warning zone | "less than one average loser of room" |
Below 1.5×, the add-trade form also shows a note when you pick that account: "Remaining buffer is under 1.5x your typical loss size." It is a note. Limbix never blocks a trade.
The Pressure column turns the same ratio into a 0–100 heuristic: 100 with no room left, 70 at 1.5×, 0 at 5× and above. It is not a probability of breach.
How to improve it#
Only two things move the ratio: more room, or smaller losers. Both are about your execution, not the market.
- Cut your loss size on a tight account. The Risk page's Warning zone shows a Cap per trade for 3 more: your buffer divided by three. That is the most one loss can cost if you want room for three more. Size your stop to fit it. See breach distance.
- Keep your losers the size you planned. One oversized loss raises your average and cuts your room at once. Loss containment shows whether your losses stop where your stop said.
- Check the rules Limbix is measuring from. A wrong Max drawdown $ or Drawdown type gives a wrong floor. Compare them with your firm's rules. See adding an account.
- Mind withdrawals. A paid payout lowers your balance and your buffer. Before you request one, check it against the safety net in the payout form. See logging a payout.
Where you'll see it#
- Risk tab (
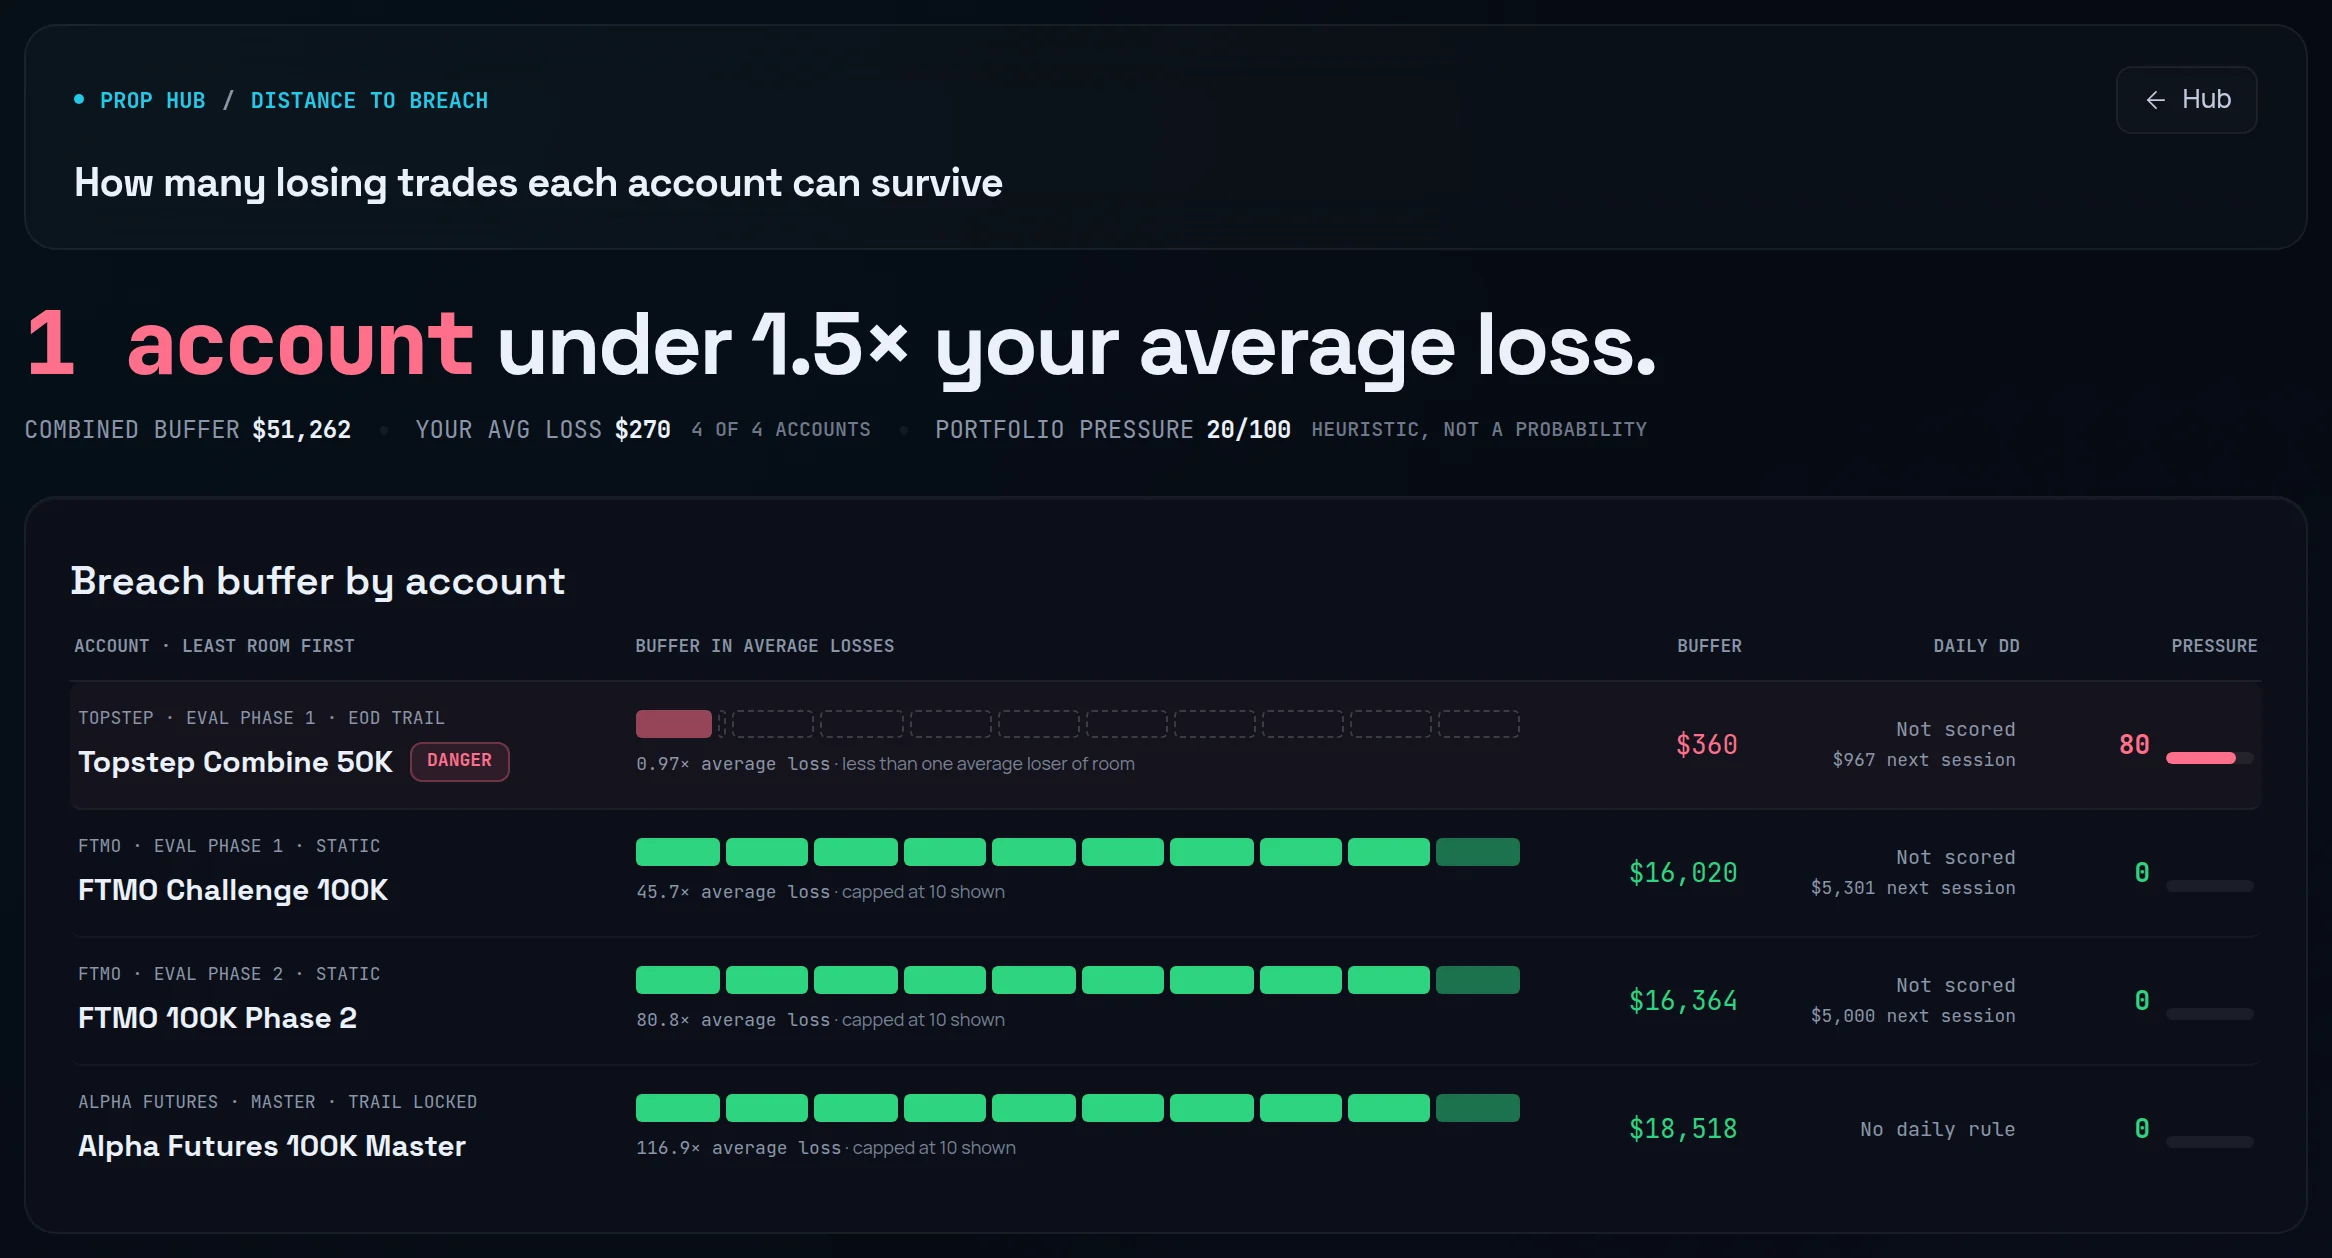
/prop/risk): headed "How many losing trades each account can survive". Each active account shows its ratio as a row of blocks, the buffer, today's Daily DD and Pressure, least room first. The lead cells show Combined buffer, Your avg loss and Portfolio pressure. - Warning zone on the same page: every account under 1.5×, with its Breach floor, Losers left and Cap per trade for 3 more.
- Add trade form: pick a prop account and the form shows its breach buffer, with the note above when the ratio is under 1.5×.
- Prop Hub board (
/prop): the DD buffer column shows the same room in currency and as a share of the full allowance.
Frequently asked questions#
What is distance to breach in a prop account?#
Distance to breach is how much you can still lose before the account hits its overall drawdown floor. Limbix measures it from your balance after any paid payouts, minus the floor set by your Max drawdown $ and Drawdown type. On a static account the floor never moves. On a trailing account it rises with your high-water mark, so a new high can leave your distance unchanged.
Is a trailing drawdown worse than a static one?#
For the same number, a trailing drawdown usually leaves you less room. A static floor stays at your starting balance minus the allowance, so profit widens your buffer. A trailing floor follows your highest balance up, so profit can leave your buffer flat. Many firms stop the trail at a lock level. Limbix names the type beside every account on the Risk page, because the same buffer means different things under each.
Why didn't my ratio go up after a winning day?#
On a trailing account, a win that sets a new high lifts the floor by the same amount, unless the trail has locked. Your buffer stays where it was, and so does the ratio. On a static account the same win widens your buffer. The ratio can also fall with no new trade: logging a Paid payout lowers your balance and your buffer. If none of this explains it, compare the account's rules in Limbix with your firm's.
Which losses count toward the average loss?#
Every losing trade on that prop account, from its first trade on. Each loss counts at its size as a positive number. Winning and break-even trades are left out. This means the average reacts to your whole record on the account, so one outsized loss moves it less as the record grows. Losses on your other accounts never mix in.
Does Limbix stop me from trading when the ratio is low?#
No. Limbix has read-only access to your trade history. It cannot place, modify or cancel orders, and nothing in Limbix blocks a trade. Under 1.5× it warns you on the Risk page and in the add-trade form. The decision to stop, or to size down, stays with you. Your stand-down line is where you can commit to that decision in advance.