
04 · Metrics
Avg Win / Avg Loss
Avg win / avg loss divides your average winning trade by your average losing trade: your realized payoff. How Limbix computes it and what ratio you need.
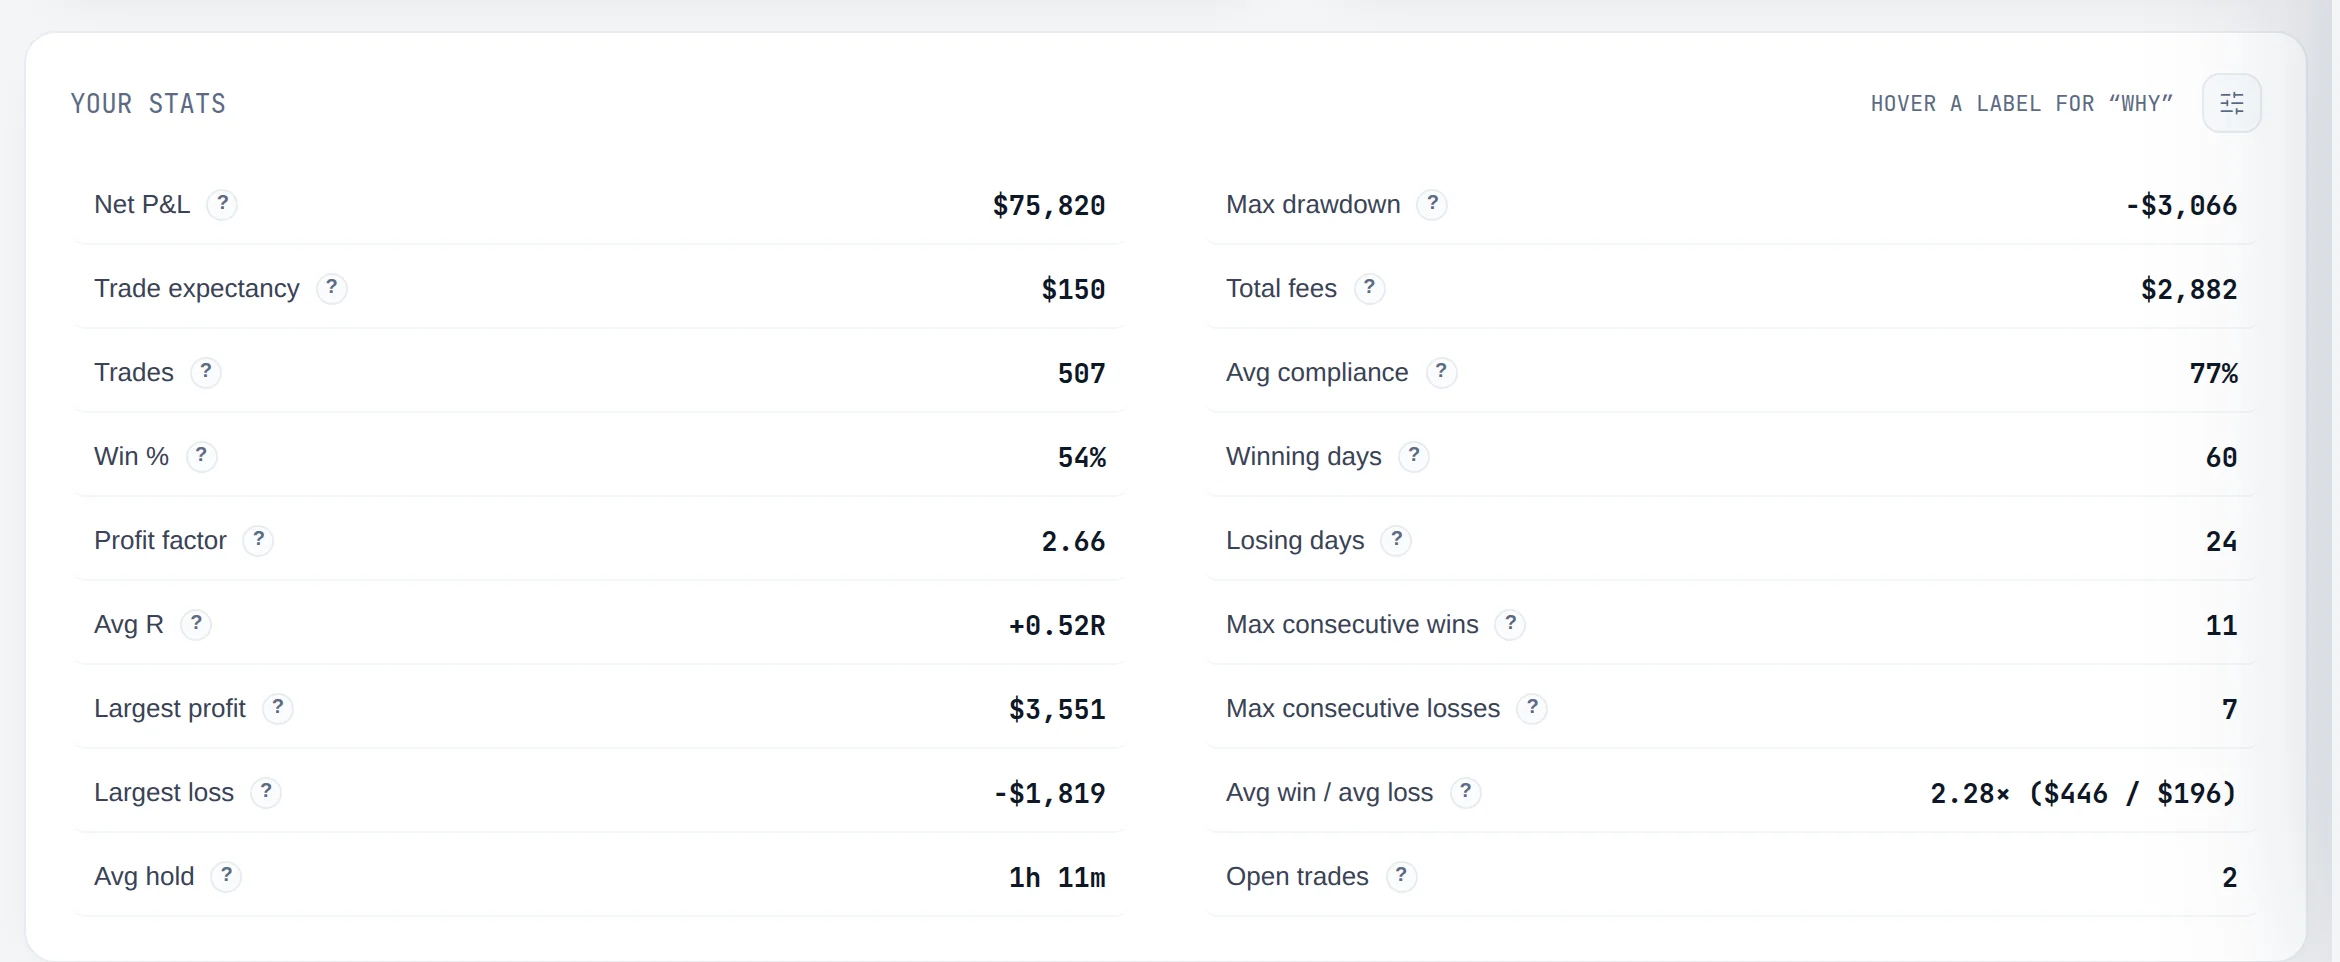
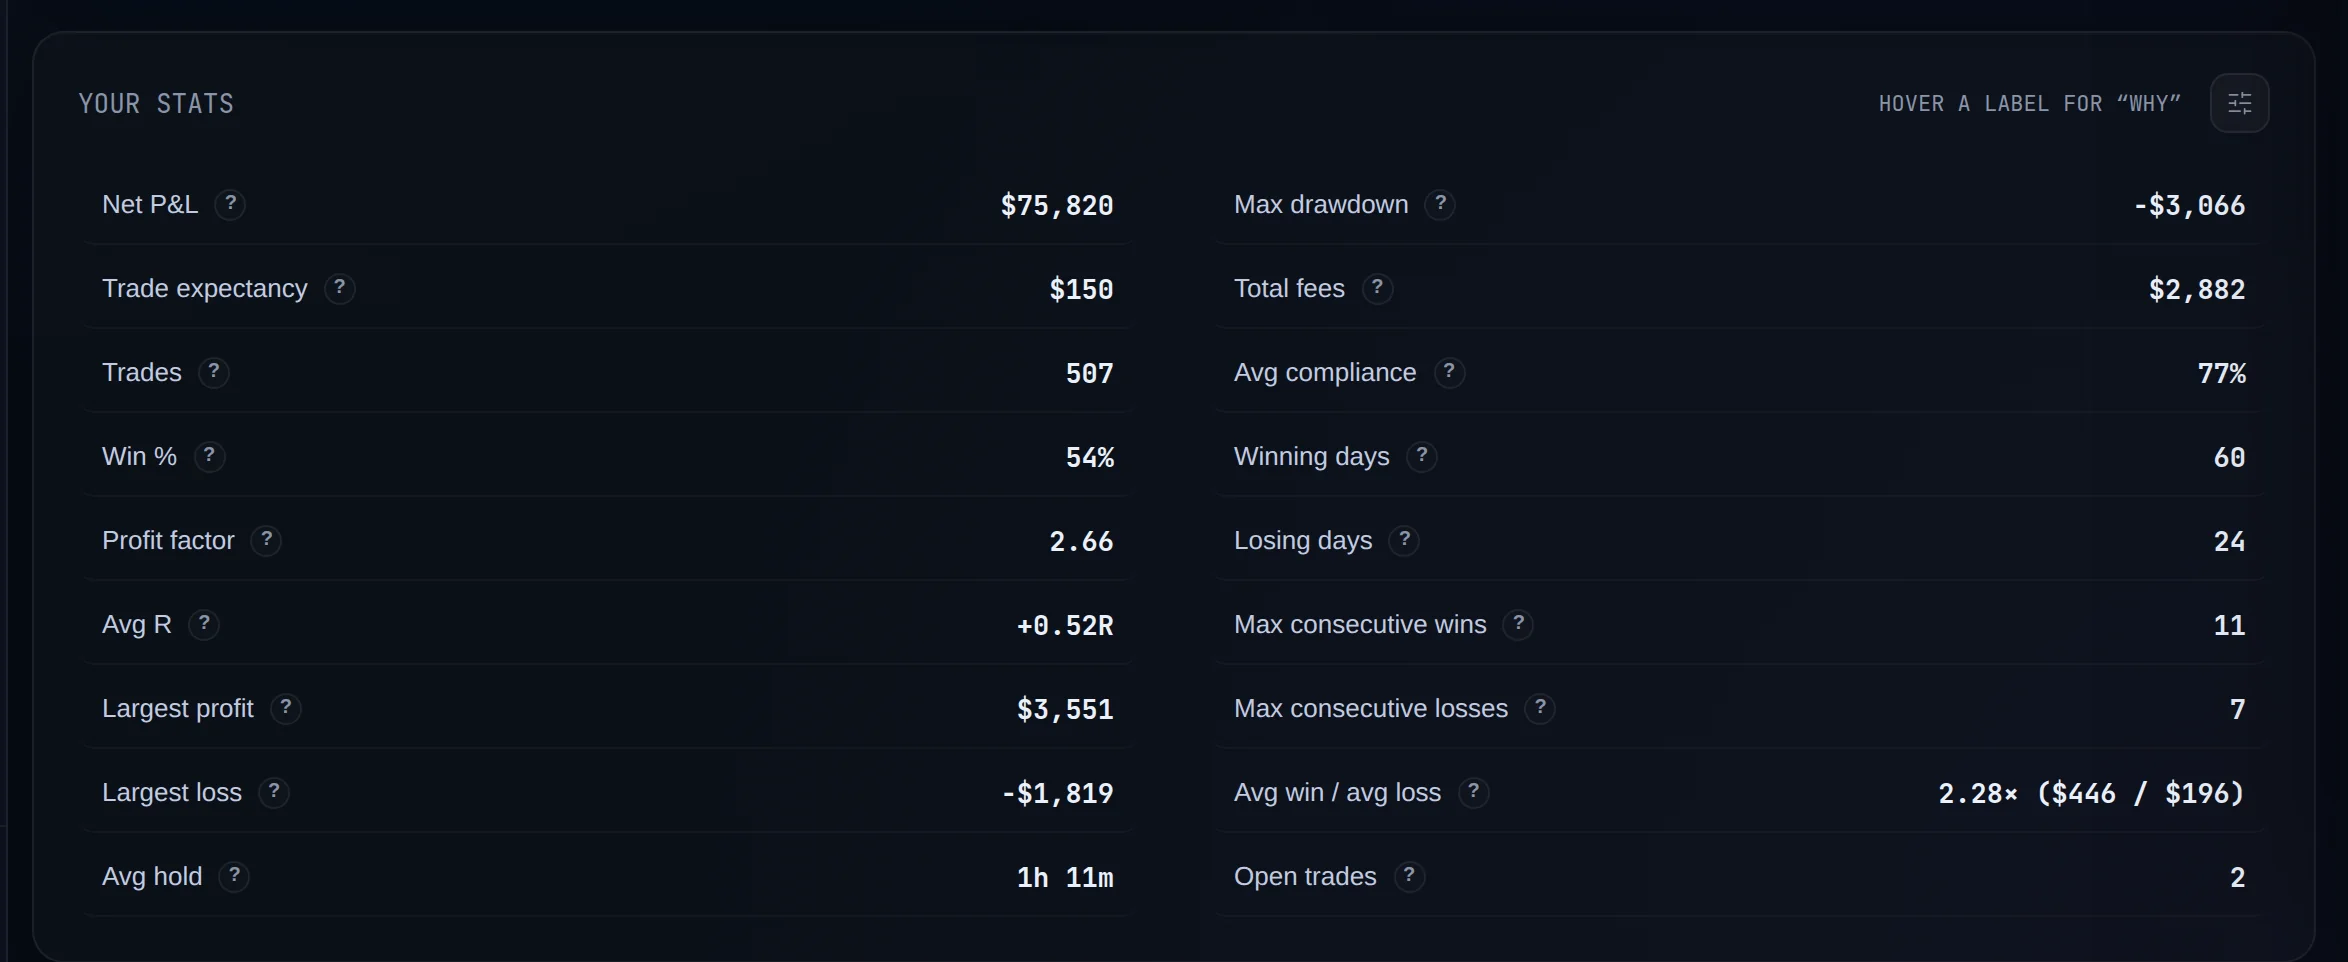
The average win to average loss ratio divides your average winning trade by your average losing trade. It is your realized payoff: 2.0× means your typical winner is twice your typical loser. Limbix computes it from closed trades only and prints both averages beside the ratio, because a ratio on its own hides how much money is involved.
How it's calculated#
- Average win
- Sum of winning trades' P&L ÷ number of winning trades
- Average loss
- Sum of losing trades' P&L ÷ number of losing trades, as a positive amount
src/lib/analytics-reports.tsOnly closed trades count. Scratch trades at exactly €0 are in neither average.
Worked example#
Ten closed trades after fees:
| Trades | Total | Count | Average | |
|---|---|---|---|---|
| Winners | +€300, +€500, +€600, +€200 | €1,600 | 4 | €400 |
| Losers | −€150, −€200, −€250, −€100, −€300 | €1,000 | 5 | €200 |
Avg win / avg loss = €400 ÷ €200 = 2.00×
The Reports ledger shows it as "2.00× (€400 / €200)".
With a 2.00× payoff, you need to win 1 ÷ (1 + 2) = 33.3% of trades to break even. You won 40%, so your trade expectancy is positive: +€60 per trade.
When it shows "—"#
| Situation | What you see |
|---|---|
| No closed winning trade in the range | "N/A" in the ledger; AVG WIN reads "N/A" with "No winners yet" |
| No closed losing trade in the range | "N/A" in the ledger; AVG LOSS reads "N/A" with "No losers yet" |
The ratio needs at least one winner and one loser. Open positions are left out of this row, unlike the trade count and win rate, which include them.
What is a good average win to average loss ratio?#
The tooltip's guide: "Target above 1.5x." The ledger paints the ratio green at 1.0× and above, amber below.
A good ratio is the one that beats your win rate. This table shows the break-even pairs:
| Avg win ÷ avg loss | You break even at a win rate of |
|---|---|
| 0.5× | 66.7% |
| 1.0× | 50.0% |
| 1.5× | 40.0% |
| 2.0× | 33.3% |
| 3.0× | 25.0% |
A scalper at 0.8× with a 65% win rate is profitable. A trend trader at 3.0× with a 22% win rate is not. Read the ratio with win rate, and let profit factor and expectancy give the verdict.
How to improve it#
The ratio moves when your exits change:
- Hold winners to the target you planned. Closing early shrinks your average win. The mistake detectors flag winners cut short of their target.
- Exit losers at the stop. A loss that runs past its stop drags the average loss up. Loss Containment shows how often.
- Keep size steady. Sizing up after a loss makes the next loser bigger. See Risk Consistency.
- Set a minimum R:R in your playbook. Limbix checks each trade's planned reward against it. See risk parameters.
Where you'll see it#
- Reports: the Avg win / avg loss row in the Overview ledger, and the AVG WIN and AVG LOSS tiles on the Wins vs Losses report. See the Overview tab and breakdowns.
- Playbooks: AVG WINNER and AVG LOSER on each playbook's page, so you can compare setups. See compare playbooks.
Frequently asked questions#
What is a good average win to average loss ratio?#
Limbix's tooltip suggests above 1.5×. The ratio you actually need depends on your win rate: at 50% you need more than 1.0×, at 40% more than 1.5×, at 33% more than 2.0×. Calculate your break-even win rate as 1 ÷ (1 + ratio) and compare it with the win rate you achieve. The gap between the two is your edge.
Is avg win / avg loss the same as risk-reward ratio?#
Not quite. Risk-reward is usually the plan: the distance to your target divided by the distance to your stop, before the trade. Avg win / avg loss is the result: what your closed winners and losers averaged. Limbix tracks both. The planned one is expected R:R on each trade; this page is the realized one across all of them.
Why does Limbix show N/A for average win or average loss?#
Because the range has no closed winning trade or no closed losing trade, so one of the two averages doesn't exist. Limbix shows N/A instead of €0, which would read as a real average. Widen the date range or remove a filter until the range includes at least one closed winner and one closed loser.
Do scratch trades affect average win or average loss?#
No. A trade that closed at exactly €0 after fees is neither a winner nor a loser, so it is left out of both averages. It still counts in your total trade count, which is why it lowers your win rate slightly while leaving this ratio unchanged.