
04 · Metrics
Avg R (Average R-Multiple)
Avg R is your mean realized R-multiple, where 1R is what you risked from entry to stop. How Limbix computes R, which trades count, and what a good Avg R is.
An R-multiple measures a trade's result in units of the risk you took: P&L divided by the amount you stood to lose between entry and stop. Avg R is the mean of those values across your trades. Limbix averages only the trades that carry an R, and tells you how many that was.
How it's calculated#
- Net P&L
- The trade's P&L after fees. R always uses net, whatever basis Reports is set to
- entry − stop
- Distance from your entry to the stop you recorded
- Point value
- Money per point for the instrument (for example, per futures contract)
- n_R
- Trades in the range that carry an R
src/lib/trade-rr.tsWhich trades carry an R:
| Trade | R |
|---|---|
| Has a stop on the right side of entry | Net P&L ÷ risk amount |
| Loser with no stop | The exit stands in as the stop, so it reads about −1R |
| Winner with no stop | No R. Left out of the average |
| Instrument with an unknown point value | No R until you add the point value |
R is defined on net P&L only. Switching Reports to Gross leaves every R figure unchanged.
Try it#
More: target price, contracts, value of one point, fees
The calculator opens with trade 1 from the example below: a long at 5,000 with a stop at 4,990, a target at 5,030 and an exit at 5,015, 4 contracts at €5 a point. Fees are €0 to keep the arithmetic clean.
- Risk amount = (5,000 − 4,990) × €5 × 4 = €200 (that is 1R)
- Expected R:R = (5,030 − 5,000) ÷ (5,000 − 4,990) = 3.0
- P&L = (5,015 − 5,000) × €5 × 4 = €300, so realized R = €300 ÷ €200 = +1.5R
Worked example#
Ten trades, with the risk amount each one carried:
| Trade | Net P&L | Risk amount | Realized R |
|---|---|---|---|
| 1 | +€300 | €200 | +1.5R |
| 2 | −€150 | €150 | −1.0R |
| 3 | +€500 | €250 | +2.0R |
| 4 | −€200 | €200 | −1.0R |
| 5 | −€250 | €250 | −1.0R |
| 6 | €0 | €200 | 0.0R |
| 7 | +€600 | €200 | +3.0R |
| 8 | −€100 | €200 | −0.5R |
| 9 | −€300 | €250 | −1.2R |
| 10 | +€200 | no stop | No R |
Nine trades carry an R. The winners add +6.5R (1.5 + 2.0 + 3.0) and the losers −4.7R (1.0 + 1.0 + 1.0 + 0.5 + 1.2), so the sum is +1.8R.
Avg R = 1.8R ÷ 9 = +0.20R
The Dashboard marks the row "9 of 10", and Reports writes "9 of 10 trades have an R". Trade 10 made money, but with no stop there is nothing to measure it against.
When it shows "—"#
| Situation | What you see |
|---|---|
| No trade in the range carries an R | A dash on the Dashboard; "N/A" in Reports, with "0 of N trades have an R" |
| Some trades have no R | The figure shows, with the count it covers ("9 of 10") |
| No trade in scope has a stop | The R unit on the Dashboard is unavailable |
When Limbix meets an instrument it can't price, the Trade Log asks you for its point value once. Until you answer, trades on that symbol have no risk amount and no R.
What is a good average R-multiple?#
The tooltip's guide: "Above +0.3R = healthy edge." Any Avg R above zero, over enough trades, means your trades make more than they risk on average.
Two things to check before you trust it:
- Coverage. An average over a subset describes the subset. If your stops are logged mostly on losers, Avg R reads negative while your account grows. Look at the "N of M" note first.
- Consistency of risk. R compares trades of different sizes fairly only if 1R means the same thing each time. Wildly different risk per trade makes R harder to read. See Risk Consistency.
Avg R is trade expectancy measured in units of risk instead of euros, over the trades that carry an R. On the Dashboard's R unit, the Expectancy row shows this same figure.
How to improve it#
- Record a stop and target on every trade. Without a stop there is no R, and the average describes fewer trades. See add a stop and target.
- Take losses at −1R. Losses past your stop pull the average down fastest. Loss Containment counts them.
- Let winners reach their target. Winners closed well short of it are flagged by the mistake detectors.
- Set a minimum R:R in each playbook. Trades planned below it fail a risk rule. See risk parameters.
Where you'll see it#
- Dashboard: Avg R-multiple in the rail, with an "N of M" note when some trades carry no R. See read the day.
- Trade Log: Avg R in the stats bar.
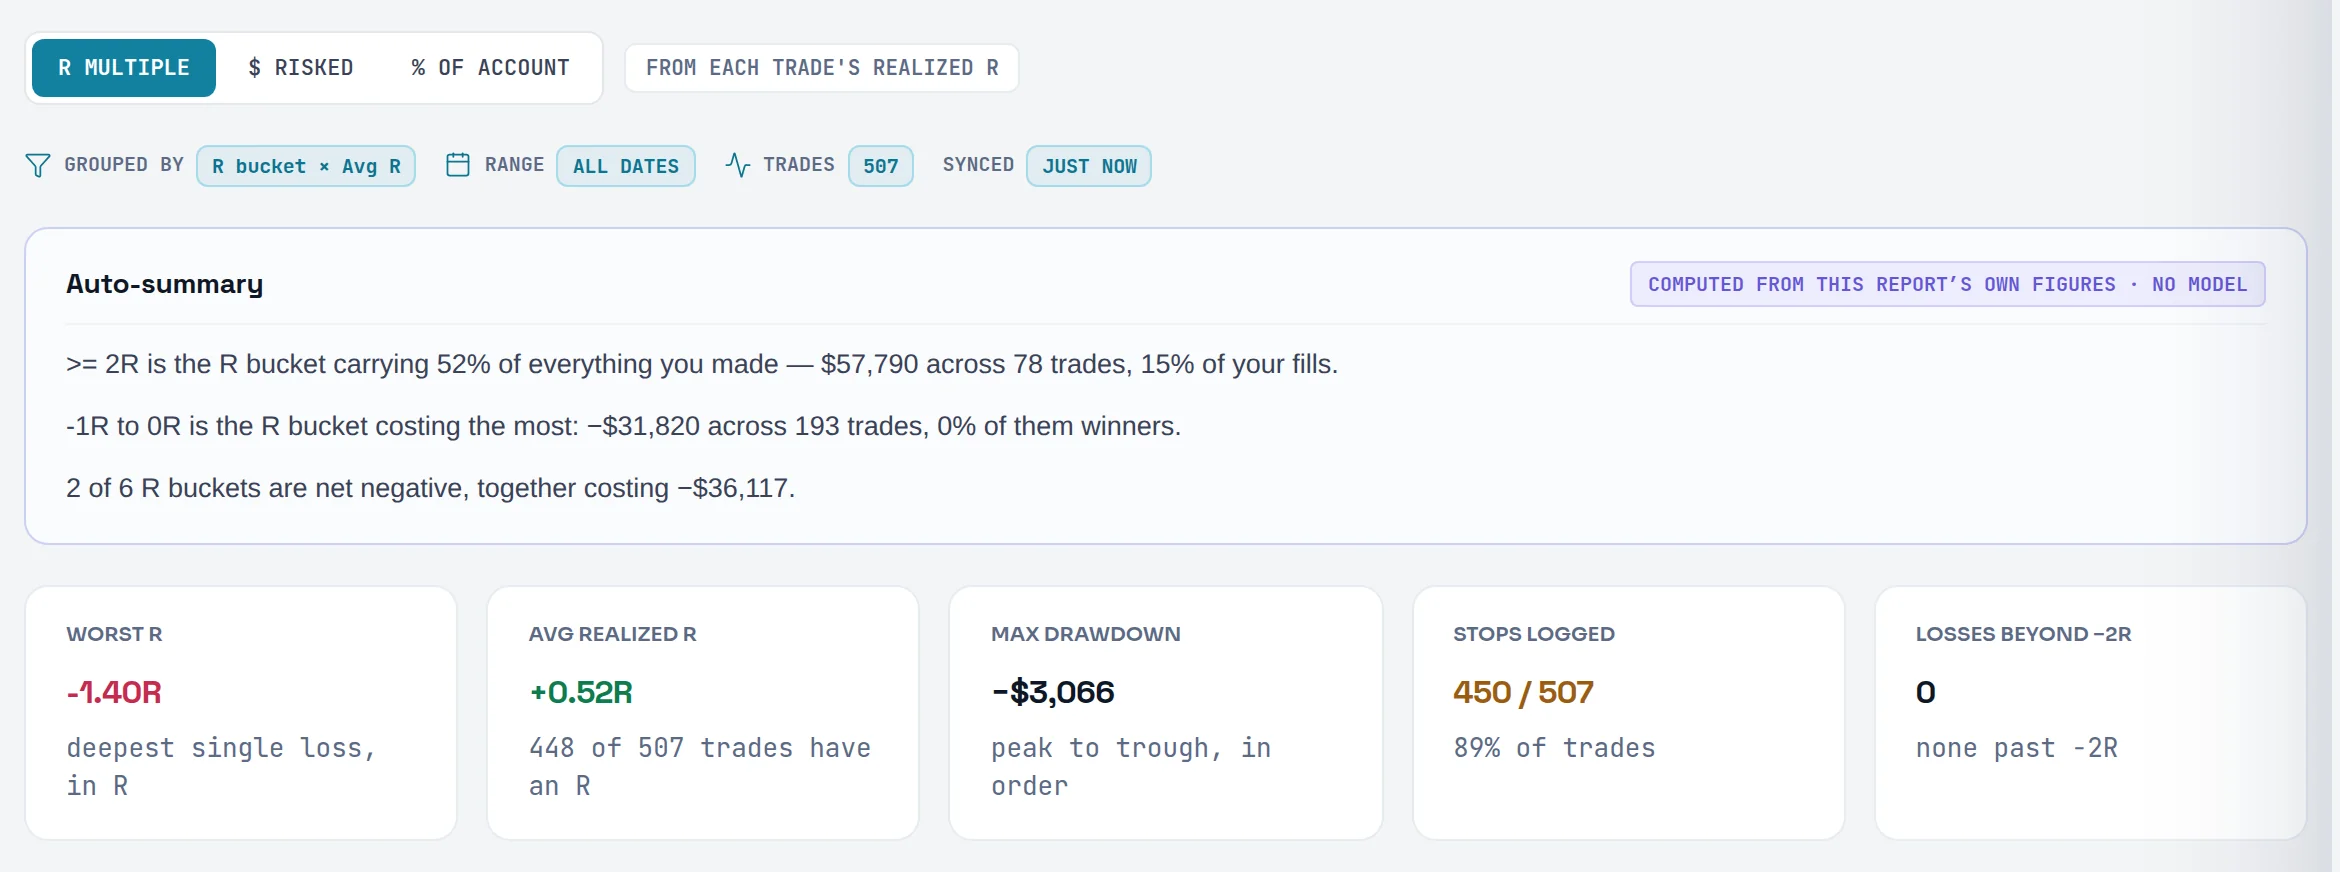
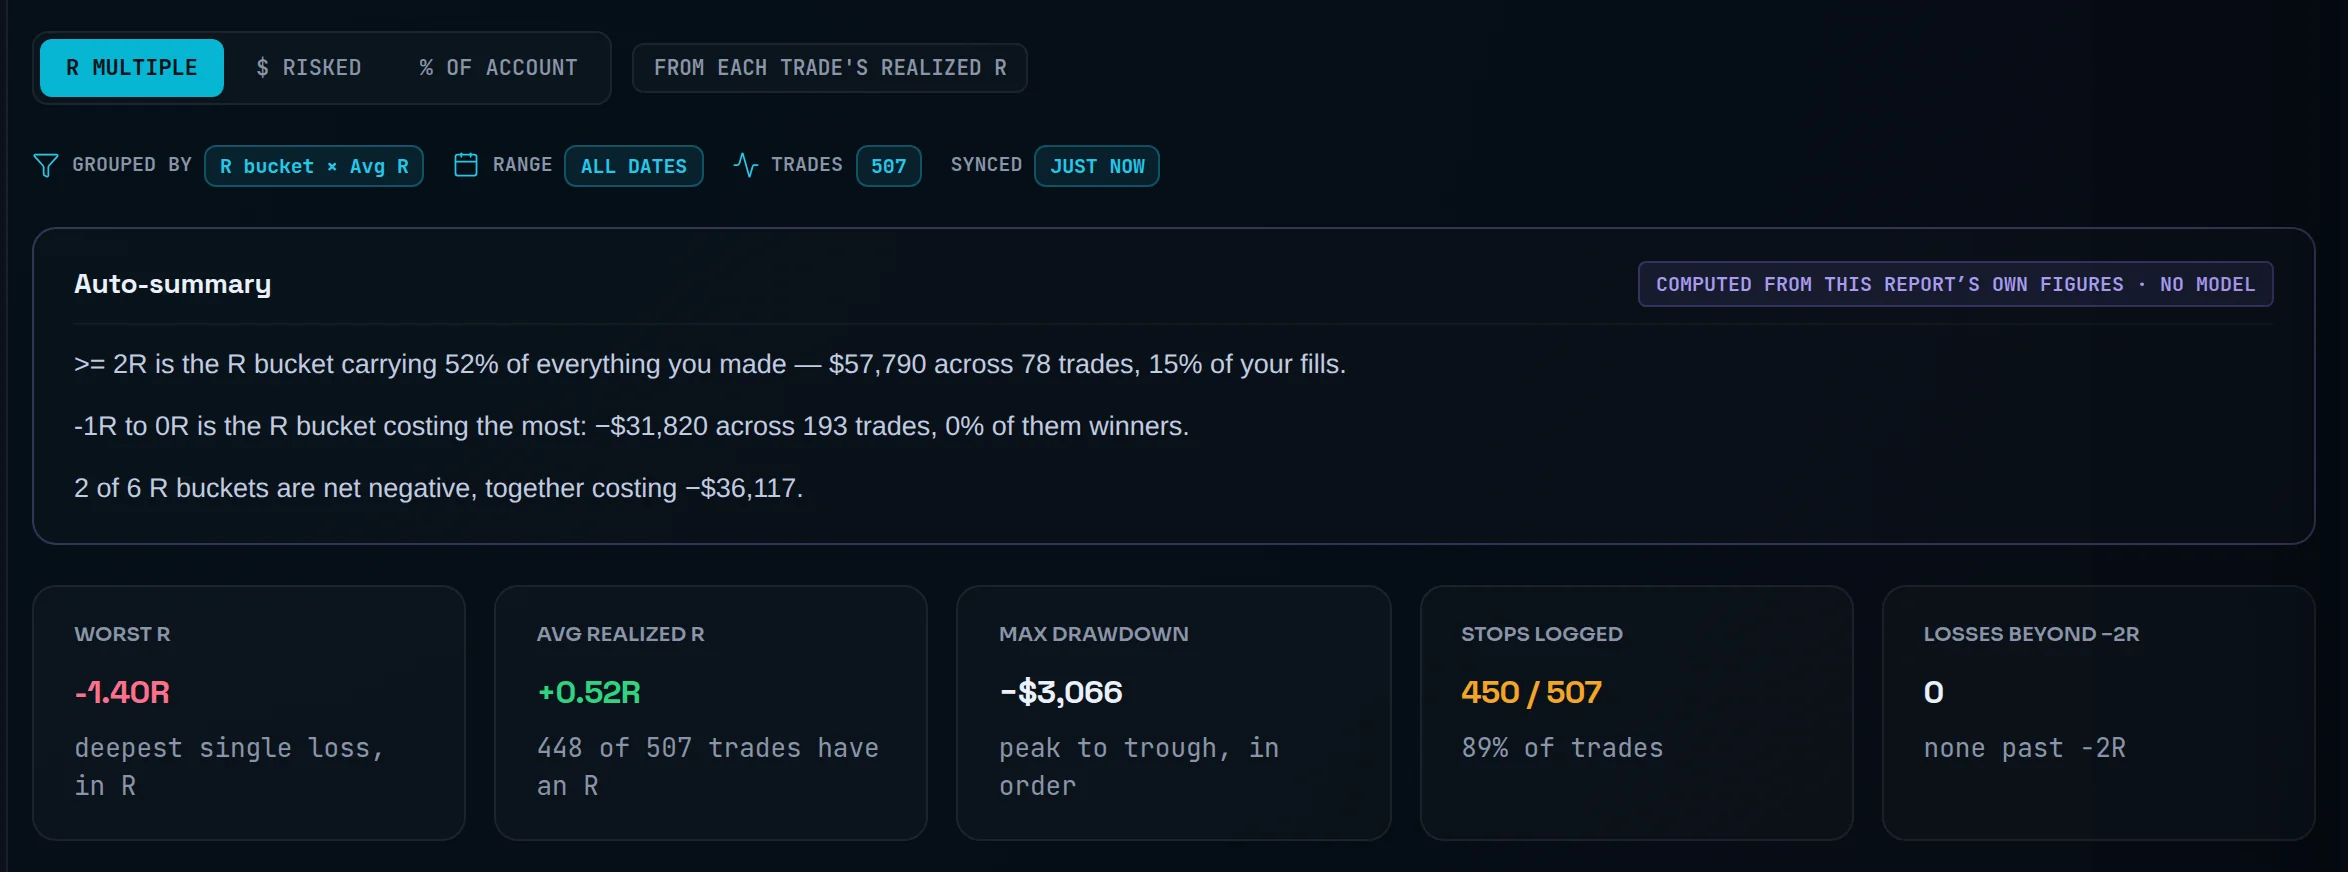
- Reports: Avg R in the Overview ledger, KPI cards and Compare; AVG REALIZED R on the Risk report. See breakdowns.
- Playbooks: AVG R-MULTIPLE on each playbook's page. See compare playbooks.
Frequently asked questions#
How do I calculate the R-multiple of a trade?#
Divide the trade's net P&L by the amount you risked. The risk amount is the distance from entry to stop, times the instrument's point value, times your quantity. A long at 5,000 with a stop at 4,990, 4 contracts at €5 a point, risks €200. If it makes €300, it is +1.5R. If it loses €200, it is −1R.
What is a good average R-multiple?#
Limbix's tooltip treats above +0.3R as a healthy edge. Anything above zero across a meaningful number of trades means your results beat your risk on average. Check how many trades the figure covers first: if only some trades carry a stop, the average describes those trades, not your whole account.
Why do some of my trades have no R?#
A trade needs a risk amount. Winners with no stop recorded have none, so they get no R. Trades on an instrument Limbix can't price also have none until you add its point value. Losers without a stop do get an R: Limbix uses the exit as the stop, which puts them at about −1R.
Why doesn't Avg R change when I switch Reports to Gross?#
Because R is always measured on net P&L. Your risk is set by your stop, and your result after fees is what you actually kept. A gross R would count a trade that made €50 before €60 of fees as a winner with a negative R. Limbix keeps R on one basis so it never contradicts itself.
Why is my Avg R negative when my net P&L is positive?#
Usually because the trades that carry an R are not a fair sample. If you record stops on losers but not on winners, the winners have no R and the average is taken mostly over losses. Look at the "N of M" note beside the figure. Recording a stop on every trade fixes the sample.