
04 · Metrics
Top Emotional Drivers
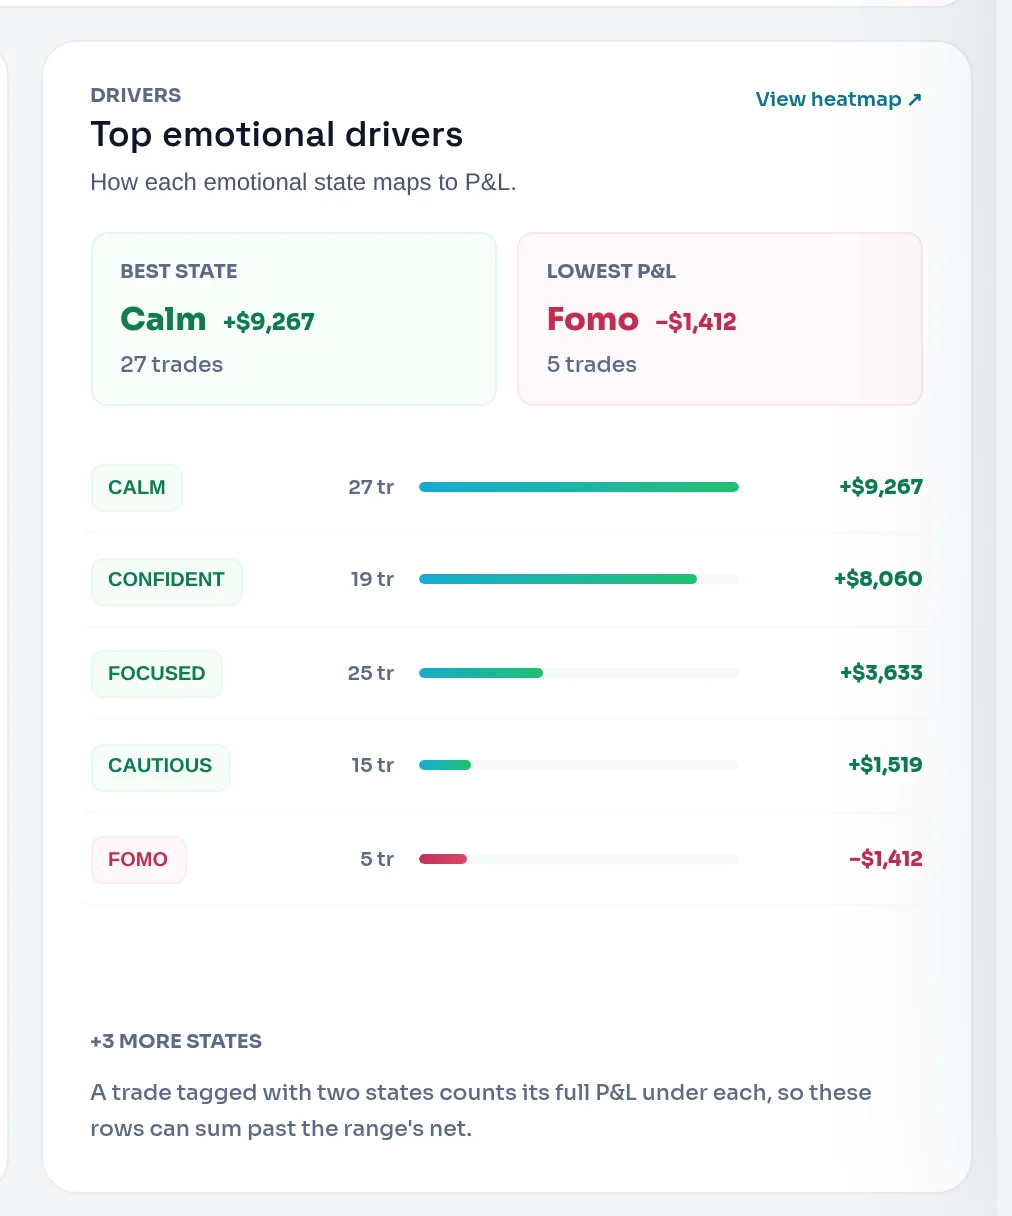
Top Emotional Drivers ranks the emotions you tagged by the size of their net P&L, gains and losses alike, so you see which states move your results most.
The emotional states attached to your biggest P&L swings right now, for better or worse. Each figure is the net P&L of the trades carrying that tag, so a trade tagged with several states counts under each of them. Limbix ranks top emotional drivers by size, so a big loss drives as hard as a big gain.
How it's calculated#
- e
- One emotion you tagged on your trades.
- Net P&L
- Each trade's P&L after fees, for the dashboard's current range and filters.
- |Driver|
- The size of the figure, ignoring its sign. A −€650 state ranks above a +€500 one.
src/lib/dashboard.tsThe sum is the same one the Emotional Heatmap uses. What differs is the ranking and the cut:
- Limbix totals net P&L per emotion and ranks the states by size, largest first.
- The dashboard card draws the top five and says +N more states if there are others.
- Two boxes above the list name the highest and the lowest figure among the rows shown.
Worked example#
Your tagged trades this month net out like this per emotion:
| Emotion | Trades | Net P&L | Rank by size |
|---|---|---|---|
| FOMO | 2 | −€650 | 1 |
| Calm | 2 | +€500 | 2 |
| Confident | 2 | +€430 | 3 |
| Anxious | 1 | −€410 | 4 |
FOMO leads the card even though it lost money, because €650 is the biggest swing. The boxes read Highest P&L · Calm +€500 and Lowest P&L · FOMO −€650. Neither says "best" or "worst", because no state has 10 trades yet.
Two of those trades carried two tags each, so the four rows sum to −€130 while the month netted +€100. The card says so under the list: "A trade tagged with two states counts its full P&L under each, so these rows can sum past the range's net."
When it shows "—"#
| What you see | Why |
|---|---|
| Nothing tagged with "Tag a trade with how you felt and your drivers appear here." | No trade in the range carries an emotion tag |
| No boxes above the list | Only one state is tagged, so there is nothing to compare |
| Highest P&L / Lowest P&L instead of Best state / Worst state | That state has fewer than 10 trades, or its sign doesn't support the word |
What do good top emotional drivers look like?#
There is no benchmark. Read the card for concentration, not for a score:
- Good sign: your largest gains sit in the states Limbix treats as constructive (Focused, Confident, Calm), and no destructive state (FOMO, Fearful, Frustrated, Tilted, Stressed and similar) ranks near the top.
- Warning sign: the top row is red and belongs to a state you can name before you enter. That is a pattern you can act on at the next session.
How to improve it#
- Tag honestly and every time. An untagged trade is invisible here. See tag emotions on a trade.
- Open the heatmap for the full list. The card links View heatmap ↗. See read the emotional heatmap.
- Plan around your costliest state. Name it in your pre-trade check-in. See check-ins.
Where you'll see it#
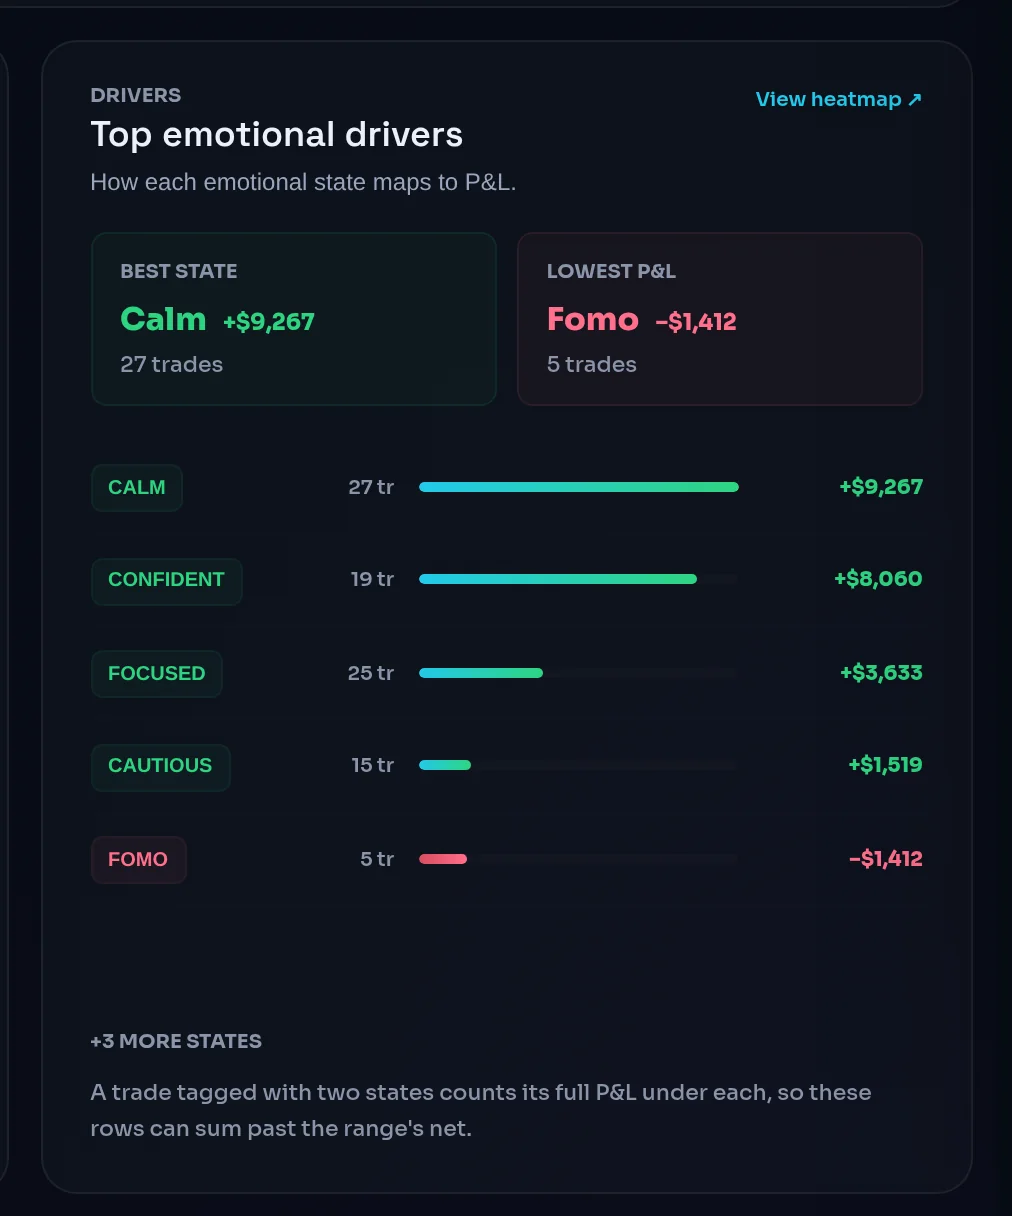
- Dashboard: the Top emotional drivers card ("How each emotional state maps to P&L."). See the Dashboard guide.
- Analytics › Summary: P&L by emotional state draws the three largest gains and the three largest losses, with a link to the rest on the heatmap. See the Analytics guide.
Frequently asked questions#
Why is a losing emotion at the top of my drivers?#
Because the card ranks by the size of the P&L, not by whether it was a gain. An emotion tied to −€650 moved your results more than one tied to +€500, so it ranks first. The colour tells you the direction: red rows lost money, green rows made it. The two boxes above the list name the highest and lowest figures separately.
What is the difference between Top Emotional Drivers and the Emotional Heatmap?#
They use the same numbers: net P&L per tagged emotion. The drivers card is the short version on your dashboard, ranked by size and cut to the top five. The Emotional Heatmap shows every emotion, a weekday grid, win rates, averages and sample badges, and lets you drill into the trades.
Why does my drivers card say "Highest P&L" instead of "Best state"?#
"Best state" is a claim about your trading psychology, and Limbix only makes it with evidence. The state needs at least 10 trades in the range and a positive figure. With fewer trades, or a figure that is negative, the box states the plain fact instead: which of the listed states has the highest P&L.
Can one trade count under two emotional drivers?#
Yes. A trade tagged Calm and Confident adds its full net P&L to both rows. That is why the rows can add up to more, or less, than your net P&L for the range. The card prints a note under the list whenever at least one trade in the range carries two or more emotion tags.