
04 · Metrics
Trade Expectancy
Trade expectancy is your average P&L per trade: net P&L ÷ trades, or win% × avg win − loss% × avg loss. How Limbix computes it and how to raise it.
Trading expectancy is the average profit or loss you make per trade: total P&L divided by the number of trades. It equals win rate × average win minus loss rate × average loss. Limbix shows it in money per trade, and shows a dash instead of zero until there is at least one trade to average.
How it's calculated#
- Σ P&L
- Net P&L of every trade in the range (Gross in Reports if you switch)
- n
- Number of trades, scratches included
- W, L
- Share of trades that won, share that lost
- avg win, avg loss
- Average winning trade, average losing trade (as a positive amount)
src/lib/metrics.tsThe two forms are the same number. Limbix calculates the first. Use the second to see which part moved when your expectancy changes: how often you win, how much you win, or how much you lose.
Try it#
The calculator opens with the worked example: net P&L €600 over 10 trades.
Worked example#
Ten trades, after fees: four winners (+€300, +€500, +€600, +€200), five losers (−€150, −€200, −€250, −€100, −€300) and one scratch at €0.
Expectancy = €600 ÷ 10 = €60 per trade
View formula in the tooltip reads: "Net P&L / Trades = €600 / 10 = €60.00 per trade".
The decomposed form gives the same answer:
| Part | Calculation | Value |
|---|---|---|
| Win side | 40% × €400 average win | +€160 |
| Loss side | 50% × €200 average loss | −€100 |
| Scratch | 10% × €0 | €0 |
| Expectancy | +€60 |
This is why expectancy is the number to watch. Each trade you take the same way adds about €60 on average.
When it shows "—"#
| Situation | What you see |
|---|---|
| No trades in the selected range | "—" on the Dashboard, "N/A" in Reports; the formula line reads "Not enough data yet — keep logging." |
| Analytics filter spans more than one currency | MIXED: an average of euros and dollars isn't an amount |
Open trades count in the trade total at €0 until they close, so a range with open positions shows a slightly lower expectancy.
What is a good trading expectancy?#
The tooltip's guide: "Must be positive to be profitable long-term." Above zero, more trades taken the same way means more money. Below zero, every extra trade digs deeper.
How much is good depends on what you risk. €60 per trade is excellent on €100 of risk and thin on €2,000. Divide expectancy by your typical risk per trade to compare across account sizes, or read Avg R, which already does it per trade.
Expectancy ties three numbers together. If win rate drops but Avg Win / Avg Loss rises enough, expectancy holds. Watching one without the others is how traders "improve" a number and lose money.
How to improve it#
Each term in the formula is an execution habit:
- Raise the average win. Let winners reach the target you planned. Winners closed early are flagged by the mistake detectors.
- Cut the average loss. Exit at your stop, not past it. Loss Containment tracks it.
- Cut losing trades you didn't plan. Trades outside your playbooks are impulsive and often sit on the loss side. Link a playbook to every trade.
- Stop at your line. A pre-committed stand-down line keeps tilt trades out of the average.
Where you'll see it#
- Dashboard: Expectancy in the rail, with View formula in its tooltip. In the R unit, the rail shows expectancy in R instead: the same figure as Avg R. See read the day.
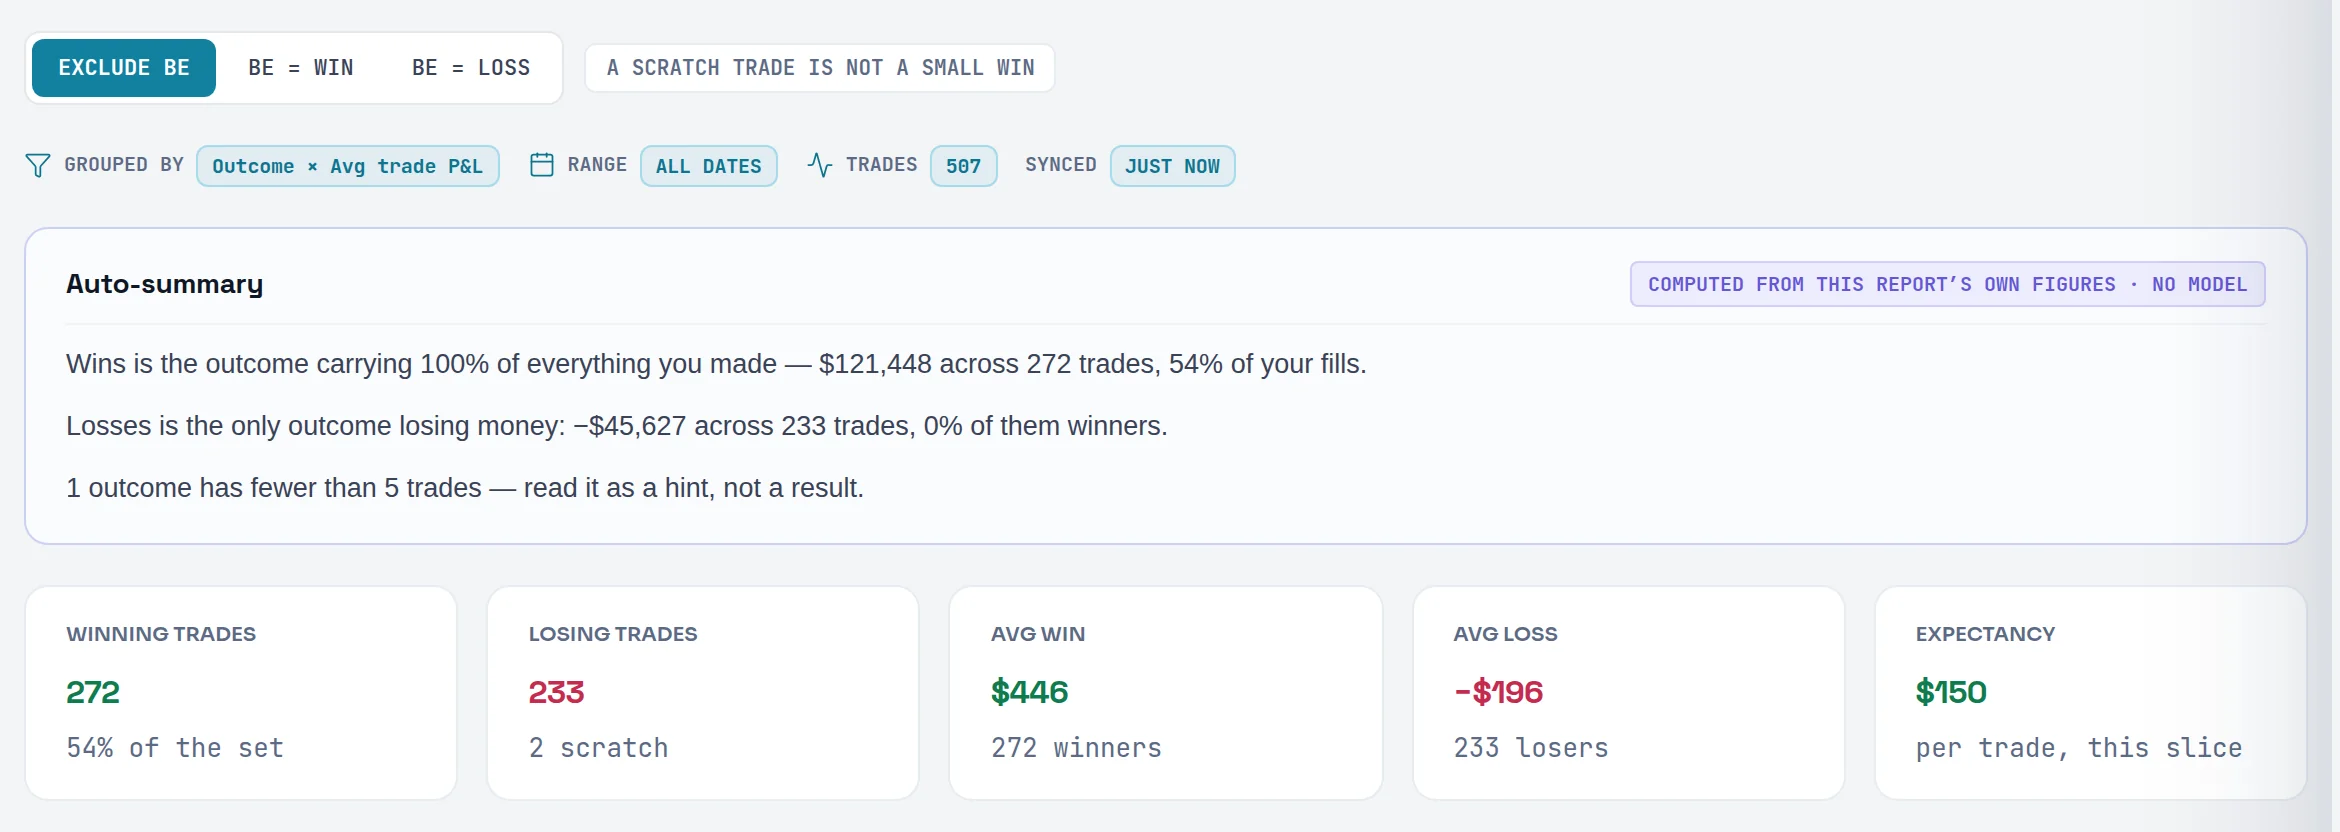
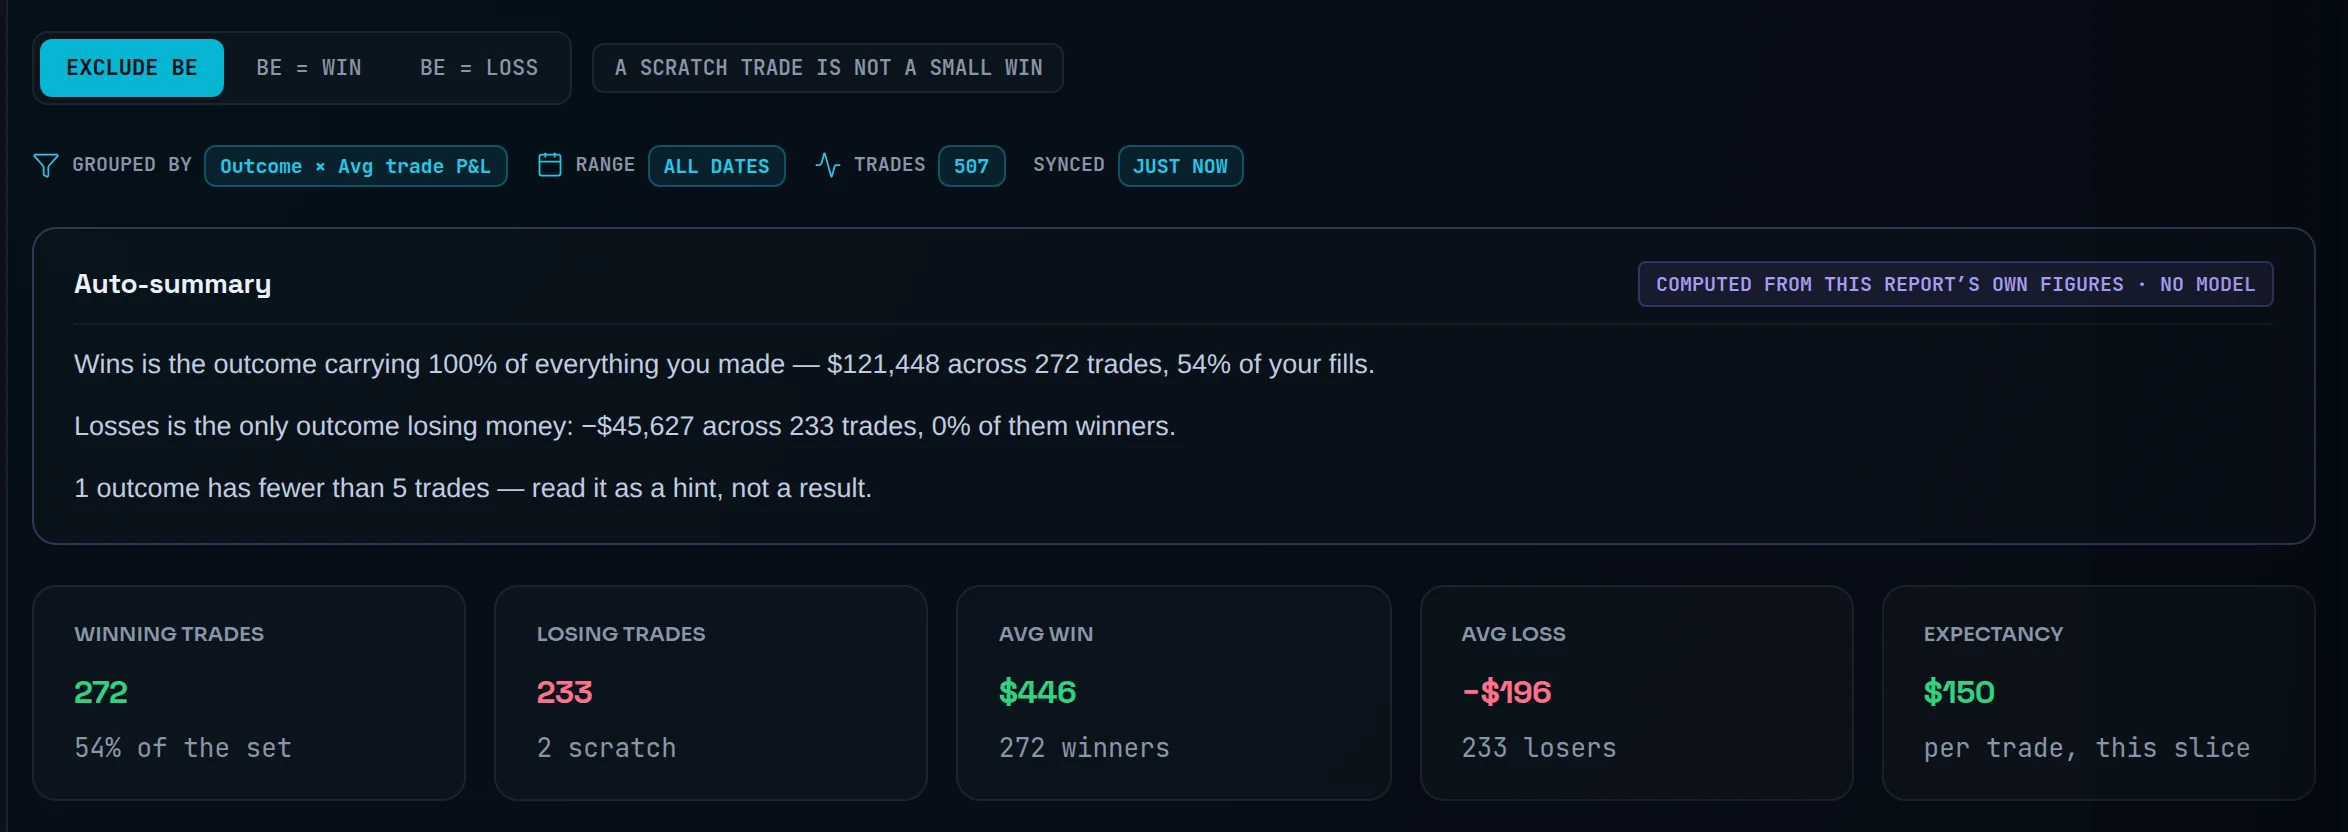
- Analytics: EXPECTANCY in the summary strip, per trade.
- Reports: Trade expectancy in the Overview ledger, EXPECTANCY on the Wins vs Losses report, and a row in Compare. See breakdowns.
- Playbooks: EXPECTANCY on each playbook's page, per trade. See compare playbooks.
Frequently asked questions#
How do you calculate trading expectancy?#
Divide your total P&L by the number of trades. Or, equivalently, multiply your win rate by your average win and subtract your loss rate times your average loss. With 40% winners averaging €400 and 50% losers averaging €200, expectancy is €160 − €100 = €60 per trade. Limbix uses net P&L after fees and counts scratch trades in the total.
What is a good expectancy in trading?#
Any positive expectancy measured over enough trades is an edge. Its size only means something against your risk. €60 per trade on €200 of risk is 0.3R, a healthy edge; the same €60 on €2,000 of risk is thin. Compare expectancy with your typical risk per trade, or read Avg R, which expresses results in units of risk.
Can you have positive expectancy with a low win rate?#
Yes. Expectancy weighs how often you win against how much. At a 30% win rate, if your average win is three times your average loss, expectancy is 0.30 × 3 − 0.70 × 1 = +0.2 units of loss per trade. Many breakout and trend styles work this way. A high win rate with large average losses can still be negative.
Is expectancy the same as average trade P&L?#
Yes. In Limbix they are one calculation. Reports offers Avg trade P&L as a measure you can chart by bucket, and it returns exactly the same figure as Trade expectancy. The ledger shows only expectancy so the same number doesn't appear twice under two names.