
04 · Metrics
Max Drawdown
Max drawdown is the deepest fall in your cumulative P&L from a high to a later low. Why Limbix walks it trade by trade and shows it in money, never as a %.
Max drawdown is the largest fall in your cumulative P&L from a high point to a later low. Limbix walks your trades in the order you opened them, starting from zero, and reports the deepest drop in money. It never shows it as a percentage, because the walk has no account balance to divide by.
How it's calculated#
- E_t
- Cumulative P&L after trade t, with trades in the order you opened them
- max E_s
- The highest cumulative P&L reached so far (the running peak), starting at 0
src/lib/metrics.ts- Limbix sorts the trades in your range by open time.
- It adds each trade's P&L to a running total that starts at €0.
- After each trade, it notes how far the total sits below the highest point so far.
- Max drawdown is the deepest of those gaps. It is always €0 or negative.
Try it#
The calculator opens with the ten trades below. Edit any P&L to see the drawdown and the curve change.
Worked example#
Ten trades across five days, in the order you opened them:
| Trade | Day | Net P&L | Cumulative | Peak so far | Below peak |
|---|---|---|---|---|---|
| 1 | Mon | +€300 | €300 | €300 | €0 |
| 2 | Mon | −€150 | €150 | €300 | −€150 |
| 3 | Tue | +€500 | €650 | €650 | €0 |
| 4 | Tue | −€200 | €450 | €650 | −€200 |
| 5 | Wed | −€250 | €200 | €650 | −€450 |
| 6 | Wed | €0 | €200 | €650 | −€450 |
| 7 | Wed | +€600 | €800 | €800 | €0 |
| 8 | Thu | −€100 | €700 | €800 | −€100 |
| 9 | Thu | −€300 | €400 | €800 | −€400 |
| 10 | Fri | +€200 | €600 | €800 | −€200 |
Max drawdown = −€450: from the €650 high after trade 3 to the €200 low after trade 5.
Walk the same week day by day and you get a different answer. The daily totals run €150, €450, €800, €400, €600, so the deepest daily drop is −€400 (Wednesday to Thursday). Wednesday's intraday dip to €200 vanishes because Wednesday closed at €800. Limbix reports −€450.
Here is why the percentage stays hidden. As a share of the €650 peak, −€450 is −69%. On a €50,000 account it is 0.9%. Only the second describes your risk, and the walk doesn't know your balance.
When it shows "—"#
| Situation | What you see |
|---|---|
| No trades in the selected range | "N/A" in the Reports ledger, "—" on a playbook's page |
| Your P&L never fell below a previous high | €0 |
| Your first trade loses | A drawdown from €0: the peak starts at zero, so an opening loss already counts |
What is a good max drawdown?#
The tooltip's guide: "Smaller is better - every trader hits drawdowns." There is no universal number, because a drawdown only means something against what you can afford to lose.
Three ways to judge yours:
- Against your account. Divide it by your balance yourself: −€450 on €50,000 is 0.9%.
- Against your risk per trade. −€450 when you risk €200 a trade is 2.25R: about two full losses in a row. If your drawdown is many times your typical risk, look for sizing changes or a losing streak you kept trading through.
- Against your firm's rules. On a prop account, the number that decides your account is the firm's loss limit. Buffer-to-Loss Ratio in Prop Hub measures how close you are.
How to improve it#
Drawdowns deepen when a losing stretch meets a trader who keeps trading. The levers are yours:
- Set a stand-down line. A pre-committed stop for the day ("after −3R"). Limbix counts every trade you take past it and never blocks one. See stand-down line.
- Set a max daily loss. Trades opened after it is hit are counted against your Exposure Discipline. See set your risk limits.
- Don't size up to win it back. Oversized trades after a loss deepen the hole. See Revenge Trades and Risk Consistency.
- Review the drawdown's trades. The Risk report shows the underwater curve and the trades behind it. See breakdowns.
Where you'll see it#
- Reports › Overview: Max drawdown in the ledger, and in the caption of the cumulative P&L chart ("Peak … · Max drawdown …"). See the Overview tab.
- Reports › Breakdowns › Risk: the MAX DRAWDOWN tile ("peak to trough, in order") and the Underwater curve.
- Reports › Recaps & Insights: Max drawdown in each recap's headline figures. See recaps.
- Playbooks: MAX DRAWDOWN on each playbook's page, over that playbook's trades only.
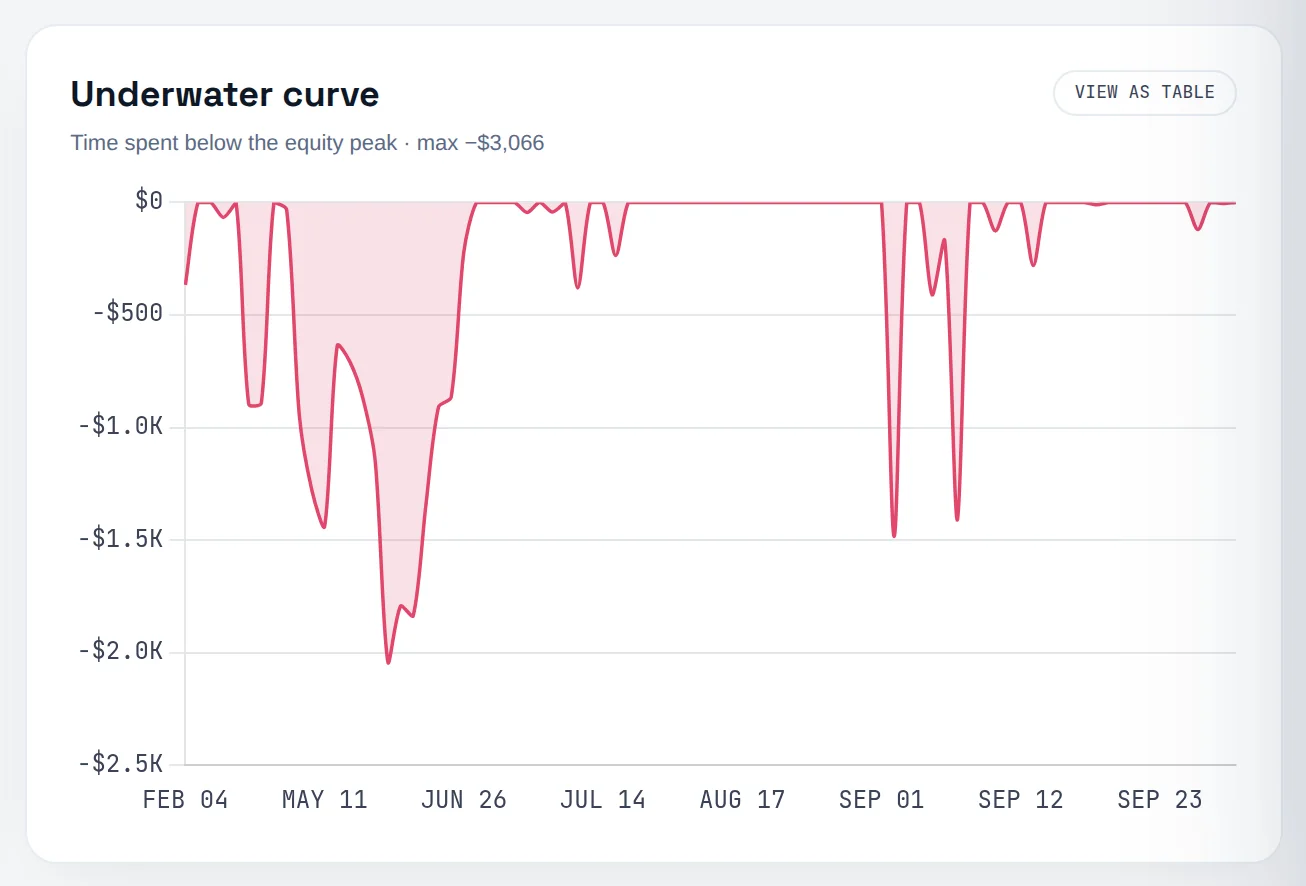
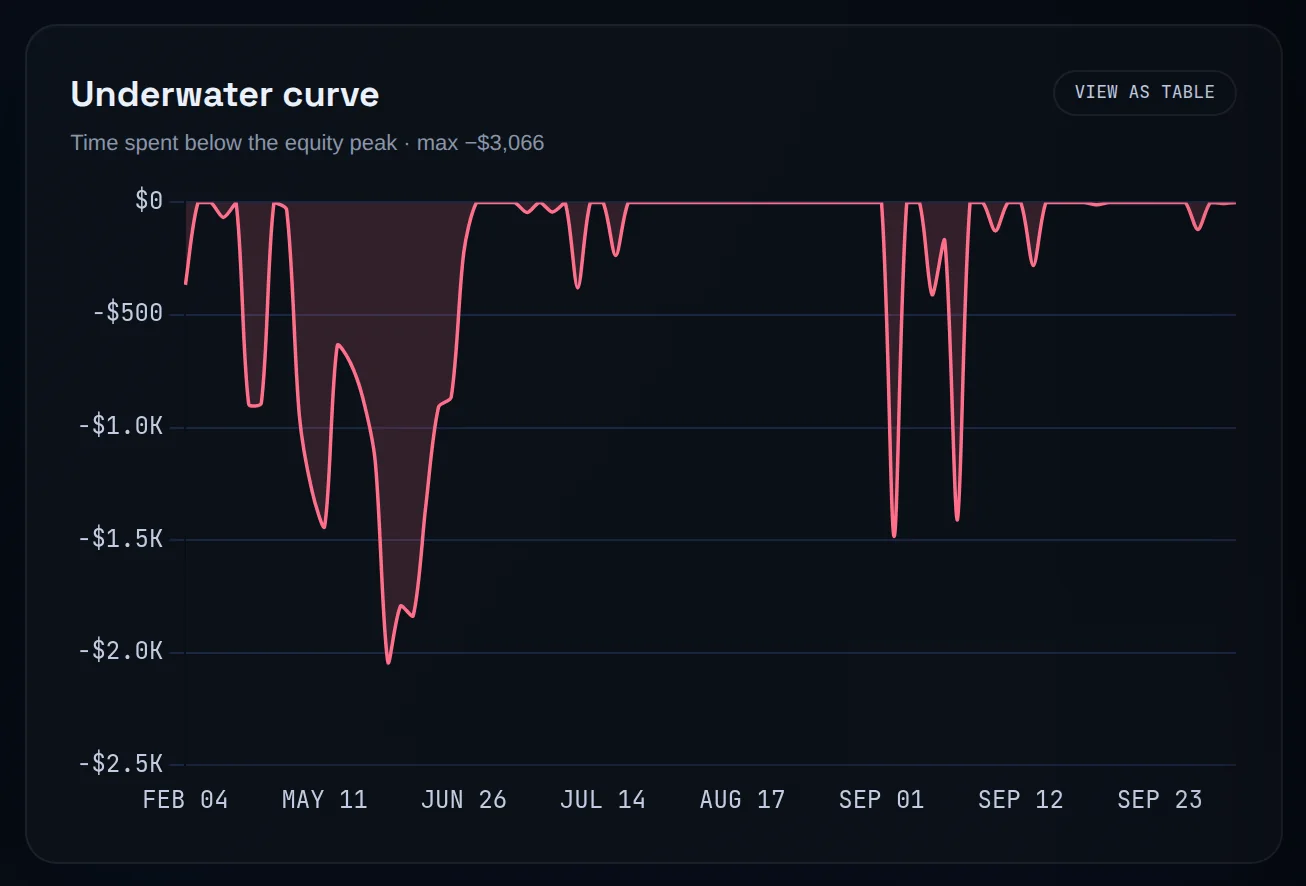
The curve shows each day's distance below your running peak, so every dip is a drawdown and $0 means a new high. Its deepest point can sit above the max drawdown in the caption: the curve plots one point per day, while the number walks every trade, intraday troughs included.
Frequently asked questions#
How do you calculate max drawdown?#
Add up your trades' P&L one at a time in the order you took them, starting from zero. After each trade, note how far the running total is below the highest total so far. The largest of those gaps is your max drawdown. With totals of €300, €150, €650, €450 and €200, the high is €650 and the drawdown is −€450.
Why doesn't Limbix show max drawdown as a percentage?#
Because Limbix's walk starts at zero, its peak is your cumulative profit, not your account balance. A percentage of that peak can pass 100%: gain €100, lose €144, and it reads −144%. A trader reads drawdown percent as a share of the account, which this is not. Divide the euro figure by your balance to get the percentage you mean.
What is a good max drawdown for a day trader?#
One your account and your nerves can take without changing how you trade. Measure it against your balance and your usual risk per trade: a drawdown of a few full losses comes with any strategy that has losing streaks, while many times your usual risk suggests size crept up or you traded through the streak. On a prop account, the firm's daily and overall loss limits set the real ceiling.
Why is the drawdown on the chart different from the number in the ledger?#
It isn't, by design. The chart plots one point per day, week or month, because a point per trade is unreadable over a year. The max drawdown printed with it comes from the same trade-by-trade walk as the ledger. A dip inside a single day can be deeper than anything the plotted line shows, and the number reports it.
Is Limbix's max drawdown the same as my prop firm's drawdown?#
No. Your firm measures drawdown on your account balance or equity, often trailing from the highest balance and sometimes including open positions. Limbix measures closed-trade P&L in the range you pick, starting from zero. Use Prop Hub's breach distance and Buffer-to-Loss Ratio to see where you stand against the firm's rule.