
04 · Metrics
Sentiment vs Linked P&L
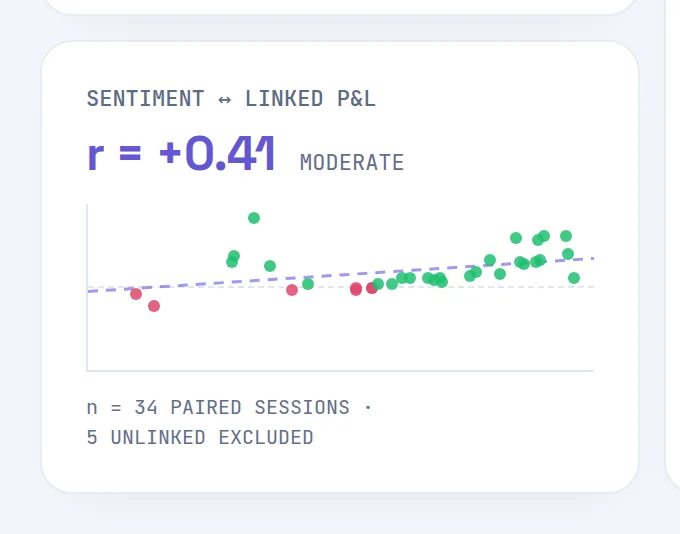
ProSentiment vs Linked P&L measures how the tone of your notebook entries lines up with the P&L of trades linked to them. A Pearson r: association, not a forecast.
How the emotional tone in each journal entry lines up with the P&L from trades linked to that entry. This is association, not prediction. Limbix measures sentiment vs linked P&L as a Pearson correlation, r, over entries that have at least one linked trade. It describes your own pattern, never the market.
How it's calculated#
- s_i
- The sentiment score of one notebook entry, from −1 to +1.
- p_i
- The net P&L of the trades you linked to that entry, added together.
- i
- One paired session: an analyzed entry in the range with at least one linked trade.
src/lib/ai/correlation.ts- Take every analyzed entry in the range that has at least one linked trade. Entries with no linked trades are left out and counted as UNLINKED EXCLUDED. An entry with nothing linked has no result, and treating it as a break-even day would invent data.
- Pair each entry's score with the net P&L of its linked trades.
- Compute Pearson's r. It runs from −1 to +1, and Limbix rounds it to two decimals. If every score or every P&L is the same, r is 0: a flat line has no correlation.
- Put a word on it, but only once there is enough data (see the table under "What's a good value?").
Tone → outcome sits beside it and answers a narrower question: the average linked P&L per paired session in each tone band. Its NEX READS line ranks only bands with at least 3 paired sessions.
Worked example#
Over 90 days you have 15 analyzed entries. Three have no linked trades and are excluded. The other 12 pair up:
| Tone | Linked P&L | Tone | Linked P&L |
|---|---|---|---|
| +0.45 | +€220 | +0.05 | −€60 |
| −0.30 | −€310 | −0.15 | +€40 |
| +0.10 | +€90 | +0.35 | +€150 |
| +0.62 | −€140 | −0.40 | −€90 |
| −0.55 | −€260 | +0.50 | −€120 |
| +0.20 | +€180 | 0.00 | +€70 |
Pearson's r over these 12 pairs is +0.47. That is MODERATE, and the card reads n = 12 PAIRED SESSIONS · 3 UNLINKED EXCLUDED. Your better-toned sessions have tended to be your better sessions.
Now look closer. Your two highest-tone entries, +0.62 and +0.50, both lost money. The overall r is positive, but at the very top of the scale the pattern turns. The correlation summarises all 12 pairs, and Tone → outcome is where a single band shows. Here the Very positive band has one session, too few to rank.
When it shows "—"#
| What you see | Why |
|---|---|
| r = — and NOT ENOUGH DATA, with "n = 7 OF 12 PAIRED SESSIONS" | Fewer than 12 paired sessions in the range |
| No fit line on the scatter | Too few pairs, or every entry scored the same |
| A thin NEX READS line instead of a comparison | Fewer than two tone bands have 3 paired sessions |
| Nothing at all | Sentiment analysis is off, or you're on Essential |
What's a good sentiment vs linked P&L reading?#
There is no good r. There is only a clear one or an unclear one. Limbix labels the strength once you have 12 paired sessions:
| Size of r, ignoring sign | Label |
|---|---|
| under 0.05 | No relationship |
| 0.05 to under 0.3 | Weak |
| 0.3 to under 0.6 | Moderate |
| 0.6 or more | Strong |
The sign matters more than the size. A positive r means your calmer, more confident writing has come with better sessions. A negative r means the opposite: your most upbeat entries have come with worse results, a pattern that can point to overconfidence. Both are worth knowing. Neither is a verdict.
How to improve it#
This isn't a number to push up. What you can improve is how much it can tell you, and the Sentiment Score behind it:
- Link each session's trades to its entry. Unlinked entries are excluded. See link trades to an entry.
- Write one entry per session, before you look at the day's P&L if you can. See notebook templates.
- Read the sign against your flags. A negative r alongside Overconfidence flags is worth a conversation with NEX. See Risk Flags.
Where you'll see it#
- Sentiment Analysis (
/ai/sentiment): the Sentiment ↔ linked P&L card, with r, its strength, a scatter of every paired session and a fit line once the sample is reliable. Beside it, Tone → outcome with "avg P&L / paired session". See NEX sentiment.
Frequently asked questions#
Does my mood affect my trading results?#
In your own record, this card shows whether tone and results have moved together. A positive r means better-toned sessions came with better P&L. A negative one means the reverse. It can't prove cause: a good session can lift your mood as easily as a good mood can lift your session. Use it to spot a pattern, then test it deliberately.
Is this next-day P&L?#
No. The internal name says "next day", but the measure pairs each entry with the trades you linked to that entry. If you link a session's trades to that session's write-up, the P&L is that same session's. Tone and trades are matched by your links, not by the calendar.
How many journal entries do I need before Limbix shows a correlation?#
You need 12 paired sessions in the selected range: analyzed entries that each have at least one linked trade. Below that, the card shows NOT ENOUGH DATA and how many you have, such as "n = 7 OF 12 PAIRED SESSIONS". A correlation on a handful of points is noise, and Limbix won't dress it up as a finding.
Does my sentiment tell me how my next trade will go?#
No. It describes how your writing and your results lined up in the past, in your own journal. It says nothing about any market or any future trade. What it can do is point to a habit worth watching, such as upbeat entries before your worst sessions. What you then change about your execution is up to you.